|
Encouragement to integrate information and communication technologies into mathematics education curricula is an increasingly universal phenomenon. As a contribution to the discourse, this article discusses the potential use in the classroom of The Geometer’s Sketchpad® (Key Curriculum Press, Emeryville, CA, United States) mathematics software in modelling the derivative and related concepts in introductory calculus. In an empirical study involving first-year non-mathematics major undergraduate science students, a hypothetical learning trajectory (HLT) was conjectured and implemented for students to experience the visualisation and multiple representations of calculus concepts on the Cartesian plane with a computer graphic interface. The utilisation scheme is interpreted through the lens of the
instrumental1 approach proposed by Trouche. The HLT was partly informed by the historical development of the derivative as synthesised from the literature on the history of calculus and partly by the affordances, enablements, constraints and potentialities of Sketchpad itself. The findings of the study suggest that when exposed to the capabilities of this software, learners can experience Geometer’s Sketchpad® as an effective visualisation tool or instrument for the representation and learning of the derivative and related concepts in introductory calculus. However, the effectiveness of this tool is not a given or a foregone conclusion − it is a product of the teacher’s instrumental orchestration, gradual learner mastery of the software syntax and careful resolution of theoretical-computational conflicts that can arise during early use of the instrument.
There is increasingly firm encouragement to integrate information and communication technologies into mathematics education curricula in many countries of the world today, aided and accentuated by an unprecedented global proliferation of digital technologies. South Africa, or the Southern African region for that matter, is no exception in this global euphoria, as shown by emphasis on the use of available technology in the Curriculum and Assessment Policy Statements (CAPS) (Department of Basic Education, 2011, p. 12). The imperative to introduce computing technologies into the classroom not only brings with it many new opportunities for learning and teaching, but is also strongly encouraged from within the mathematical and scientific community itself. For example, Borwein (in press) points out that the computer has become one of the main and indispensable tools for experimentation and research in many parts of pure and applied mathematics. Today most problems in the ‘real world’, in the scientific community and society broadly, can only be tackled, modelled and investigated with the aid of computing technology. Indeed, there has been a noticeable shift in the last 50 years towards favouring numerical methods and discrete modelling with difference equations and recursion in industry as opposed to the classic modelling techniques with continuous algebraic functions and traditional calculus. For example, the problems engineers and scientists frequently investigate today almost as a rule lead to differential equations which can only be solved numerically. Computing technology is therefore also seriously challenging the very content and focus of aspects of traditional mathematics curricula at school and university, and gradually beginning to force curriculators to start grappling with the ‘uncomfortable’ question about what is still relevant and what is not, and which new skills are essential for a modern computing society. In order to integrate the new technologies into the classroom, the challenge for teachers is to master the new tools and simultaneously to find ways to enhance or empower learners’ mathematical learning. One difficulty cited by Robert and Rogalski (2005) has been that teachers’ practices are both complex and stable. Some studies (e.g. Jenson & Williams, 1992) show that the integration of technology initially complicates rather than simplifies the teacher’s life. Lagrange and Monaghan (2009) additionally argue that the availability of technology amplifies the complexity and, as a consequence, challenges the stability of teaching practices: techniques used in ‘traditional’ settings can no longer be applied in a routine-like manner when technology is available. A new repertoire of teaching techniques (e.g. where each learner or small group of learners has access to a computer in the classroom) demands a renegotiation of the traditional didactic relationships between the teacher, mathematics and the learner. Even if only the teacher has a laptop or computer connected to a data projector in the classroom, this affords the teacher a much wider range of teaching possibilities than a static blackboard or overhead projector. These new techniques are likely to be related to already existing ones as well as to teachers’ underlying views on mathematics education (Pierce & Ball, 2009). In spite of the existence of innovative techniques, integration of some of the technologies in mathematics classrooms remains marginal (e.g. Haspekian, 2005) and, ironically, lags behind the abundant availability of technology in the public domain. In order to help teachers benefit from the new technology in mathematics teaching, it is pertinent to deliberate on the mediation possibilities that the new technological tools offer. To contribute towards such a discourse, this study sought to investigate the viability of using The Geometer’s Sketchpad® dynamic mathematics software as a pedagogical tool to enhance learners’ understanding of the concept of ‘derivative’ in introductory calculus. This initially poses challenges to many learners because of the underlying limit concept that is difficult to grasp at first encounter with calculus, in terms of ruptures (discontinuities or false continuities) that occur in transitions from the finite to the infinite and the infinitesimal. Although it might be easy for learners to equate the ‘derivative’ with ‘the thing that changes xn into nxn–1’ (Wu, 1999, p. 13), on its own this traditional symbolic manipulation approach evokes little conceptual understanding in learners (Tall, 1997, p. 289). Dynamic geometry software such as Sketchpad, Cabri and Geogebra, and computer algebra systems (CAS) such as Derive, Maple and Mathematica allow for numeric, graphic and symbolic or algebraic representations to be generated simultaneously in both static and dynamic forms, in a manner that has potential to foster deeper conceptual understanding based on real-time visualisation in the graphic interface. Although these new tools hold so much promise, they do not immediately translate into efficient mathematical instruments in the classroom or realise the epistemic value of the associated instrumented techniques; that is, the way in which they contribute to the understanding of the objects they involve may not be immediately accessible to learners (Artigue, 2002, p. 245). That these software packages are relatively new tools makes their efficient integration into mathematics classrooms a pedagogical research imperative. Based on Ndlovu (2008), this article describes a possible theoretical framework for a Sketchpad-mediated teaching sequence from an instrumental approach. The research questions that guided the study are then presented and the research methodology and procedure explained before presenting and discussing the results. Finally, some conclusions and recommendations are drawn.
The instrumental approach to technology use in the classroom
The theory of instrumentation inspired the instrumental approach to tool use in technology-rich environments, as elaborated by Trouche (2004) to describe the context of human-machine interaction. The approach helps us to understand the influence of tools on the mathematical approach and on the building of learners’ conceptual understanding (knowledge) through a process referred to as ‘instrumental genesis’ wherein, in our case, the dynamic mathematics software Sketchpad becomes the mathematical work tool to empower students’ learning of the derivative and related concepts. This instrumental genesis depends on the software constraints and potentialities (constraints, enablements, affordances, and potentialities), students’ knowledge in the form of utilisation schemes (usage schemes and instrumented action schemes), and the teacher’s instrumental orchestrations in the form of didactical configurations and exploitation modes, elaborated upon below.The term ‘tool’ is preferred to the term ‘machine’, and is used in the sense of something which is available for sustaining human activity (Trouche, 2004, p. 282). Before a tool can be used, it is a material artefact or given object (e.g. hammer or computer) or cultural artefact (e.g. language). The tool or artefact has potential to shape the environment in the sense that ‘tools wrap up some of the mathematical ontology of the environment and form part of the web of ideas and actions embedded in it’ (Noss & Hoyles, 1996, p. 227). However, when a tool or artefact is appropriated by the subject and integrated into his or her own activity, it becomes an instrument which is a psychological construct (Verillon & Rabardel, 1995) in cognitive ergonomics. More precisely then, an instrument can be considered to be an extension of the body or ‘a functional organ made up of an artefact component and a psychological component’ (Trouche, 2004, p. 285). The organ construction procedure is referred to as instrumental genesis, a complex process needing time and linked to the artefact’s characteristics (its potentialities and constraints) and to the subject’s activity, knowledge and former method of working (Trouche, 2003, 2004). This procedure is characterised as consisting of a combination of two sub-processes: an instrumentation process directed towards the subject, and an instrumentalisation process directed towards the artefact (Trouche, 2003, 2004).
Instrumentation
Instrumentation is the process by which the computer user is mastered by his or her tools or by which the artefact prints its mark on the subject by allowing him or her to develop activity schemes within some boundaries or limits – the constraints (obliging the user in one way and impeaching in another way), enablements (effectively making the user able to do something), potentialities (virtually opening possibilities) and affordances (favouring particular gestures or movement sequences) of the artefact (Noss & Hoyles, 1996; Trouche, 2004). Guin and Trouche (1999, 2002) distinguish between three types of constraints: internal constraints intrinsically linked to the hardware, command constraints linked to the syntax of the various commands, and organisation constraints linked to the interface between the artefact and the user (e.g. symbolic, numeric and/or graphic).
Instrumentalisation
Instrumentalisation can go through different stages that can include discovery and selection of relevant functions, personalisation and transformation of the artefact, sometimes in directions unplanned or not conceived of by the designer (Trouche, 2004) but inadvertently enabled by the architecture and configuration (enablements and potentialities) of the artefact. For example, Sketchpad was not meant ‘to generate’ but ‘to show’ the derivative of a function graphically and symbolically. Drijvers (2002, p. 225) refers to this gap between the (symbolic) solution process and the final result as the top-down and ‘black box’ character or non-transparency of a computer algebra system (CAS). However, by plotting the tangent slope of a function at any given point against changes in the independent variable, Sketchpad can enable the user to dynamically or progressively generate the graph of the derivative of a function. Similarly, one can numerically and graphically simulate the average rate of change and instantaneous rate of change of a function in real time on screen. It is this adaptability of the software that the teacher is at liberty to exploit to enhance a deeper understanding of mathematics concepts. Thus the idea of instrumental genesis reflects the fact that using a tool is not a one-way process, but a dialectic relationship between the subject acting on his or her personal instrument and the instrument acting on the subject’s thinking (Haspekian, 2005, p. 118). Trouche (2003) points out that because of this dialectic it is not always possible to distinguish clearly between these two processes.
The teacher’s instrumental orchestrations in a technology-rich classroom
Trouche (2004, p. 296) introduces the term ‘instrumental orchestration’ to point out the necessity for a given institution (e.g. a teacher) to provide external steering of learners’ instrumental genesis. He argues that this necessity is seldom taken into account when considering the environmental organisation of a technology-rich classroom in so far as the learners’ or teacher’s workspace and time are concerned. From an anthropological point of view, Lagrange (2000) notes that the teacher’s task is likely to be complicated by the use of a new environment, since mathematical knowledge and conceptualisation are highly dependent on techniques. As in the paper-and-pencil tradition, the teacher has the didactic responsibility to organise the tasks so that the learners develop and master some techniques of achieving understanding of the mathematical concepts at stake. From an instrumental point of view, the notion of a ‘scheme’ is articulated to address this complexity and consequently to inform the hypothetical learning trajectory (HLT). The scheme is part of the psychological component of an artefact organisation in that it is a dynamic functional entity with goals and anticipations, rules of action, gathering of information, control-taking and some operative invariants (Trouche, 2004). Trouche consequently views a scheme as performing three main functions: a pragmatic function which allows the user of the instrument to do something; a heuristic function which allows the user to anticipate and plan actions; and an epistemic function which allows the user to understand what he is doing. The teacher’s instrumental orchestration should therefore help learners to actualise the various functions of their schemes, the most important of which is the epistemic – to develop mathematical understandings and knowledge using the artefact cum instrument. Trouche (2004) also distinguishes between two kinds of artefact utilisation schemes: usage schemes oriented towards the management of the artefact (e.g. turning on a computer, adjusting the screen contrast, choosing a particular key, etc.); and instrumented action schemes oriented towards the performance of specific tasks (e.g. computing a function’s limit). The teacher’s instrumental orchestration has to take into account that a given artefact can lead to various instruments and utilisation schemes or a system of interdependent artefacts or instruments which in turn call for chains of usage and instrumented action schemes. For example, dynamic mathematics software (an artefact by itself) has to be installed onto a computer (which is another artefact), and a projector (another artefact) and/or a smart board (yet another artefact) can be used for whole-class discussions. Learners working in Sketchpad can copy and paste their mathematical productions into Microsoft Word (which is yet another artefact). For a given artefact then, the teacher must consider various geneses enrolled in complex systems of various interacting instruments (Haspekian, 2005). In a sense, using a new tool implies a reconsideration of the teacher’s mathematical organisation (of sets of tasks, techniques and theories) to guide learners’ instrumental genesis – individually, in groups, or through whole-class activities. To clarify instrumental orchestration further, Drijvers, Doorman, Boon, Reed and Gravemeijer (2010) distinguish between three elements within a teacher’s instructional activity: a didactic configuration, an exploitation mode and a didactic performance. A didactic configuration is metaphorically defined to be an arrangement of the artefacts in the classroom environment, and as such refers to the configuration of the teaching setting (comparable to the choice and layout of musical instruments for an orchestra) to induce a sound mathematical discourse. An exploitation mode entails the way in which the teacher decides to exploit a didactical setting or configuration for the benefit of his or her instructional intentions, including decisions about how a mathematical task will be introduced and worked through (e.g. whole-class, group work, individual work, etc.). A didactic performance entails the ad hoc or on-the-spot decisions taken during the teaching-learning session regarding what question to pose, how to respond to a particular learner’s response or input, and how to deal with the unexpected.
Research questions
Whereas Ndlovu, Wessels and De Villiers (2010) focused mainly on the quantitative results of the pre-test, post-test quasi-experimental design aspects of the main study, this article reports on the qualitative aspects of the study. The learning trajectory hypothesised was the culmination of an analysis of the historical development of the derivative in the context of motion (e.g. Zeno’s paradoxes, speed and time) and of drawing tangents and finding rates of change or instantaneous speed (see Ndlovu, 2008; Ndlovu et al., 2010). The main research questions which guide this report are: (1) How can Sketchpad be used as a technological teaching tool to enhance students’ understanding of the derivative in introductory calculus? and (2) In what ways does such a teaching or learning trajectory improve the quality of domain-specific understanding of the derivative and related concepts? The following sub-questions guided the study: (1) How can Sketchpad be used to model pre-concepts of the derivative? and (2) How can the derivative be modelled in Sketchpad, to lead to its dual meaning as ‘the instantaneous rate of change’ and ‘rate of change function’?
Methodology
Participants and ethical considerations
This research is based on a teaching experiment conducted by the first author involving 20 undergraduate non-mathematics science major students at a university in Zimbabwe (Ndlovu, 2008). The students volunteered to participate in the study, were informed about its purpose and consented to participation. They were also advised that they were free to withdraw from the study at any stage and were assured that their names would be kept confidential. For this reason the names used in this article are pseudonyms. Participation in the experimental group was on a first come, first served basis. Written permission to conduct the study was obtained from the host university department with the support of the academic registrar. Permission was also granted by the departments whose computer laboratories were used.
Teaching experiment methodology and post-task-based interviews
We use the term ‘teaching experiment methodology’ to refer to a context in which the teacher’s role, as described by Steffe and Thompson (2000, p. 277−279), is continually to postulate possible meanings that lie behind students’ language and actions, so that their actions guide the teacher to construct a frame of reference in which what they can do seems rational. The methodology thus had the general form of a developmental research design, elaborated upon by Cobb, Confrey, diSeiza, Lehrer and Schauble (2003) and Gravemeijer (1994), amongst others, in which the teacher progressively develops new hypotheses to explain students’ ways of operating and designs tasks to provoke creative activity. The distinguishing characteristic of the research design therefore rests in how it links the development of an HLT, which is then implemented and later adjusted in the light of the implementation experiences. Essentially then an HLT involves the design of learning materials and activities that take into account the expected thinking or conceptual development that students might engage in with a given technological tool to achieve a particular learning goal (Drijvers et al., 2010; Simon, 1995). There is relatively widespread consensus amongst mathematics educators that deeper conceptual understanding, higher problem-solving processes, and internal constructions of mathematical meanings have to be developed in addition to traditional procedural and algorithmic learning (Goldin, 1997, p. 40). The quest to understand students’ thinking has enabled the use of structured interviews for the dual purpose of: (1) observing the mathematical behaviour of learners engaged in problem solving and (2) drawing inferences from the observations. Consequently, after each session of the implemented learning trajectory students were interviewed to ascertain their mathematical experiences of calculus concepts as mediated by Sketchpad under the instrumental orchestration of the teacher-researcher. The didactic configuration was such that each student had access to his or her own computer in the computer laboratory, where the personal computers were arranged in rows. The exploitation modes entailed availing worksheets with tasks for students to execute individually or in pairs. Students were encouraged to share experiences and observations or indeed to solicit the teacher-researcher’s assistance whenever desired. As part of the teacher-researcher’s didactic performance, the sessions were intermittently interrupted by whole-class discussions to clear up any common misunderstandings or unexpected behaviour of the software. A qualitative approach was adopted to enable both an interpretative and explanatory analysis of learner perceptions of their mathematical and software experiences. A brief description of the classroom activities which constituted the intervention follows. These activities will be discussed with reference to the Sketchpad enablements and constraints for modelling functions, the average rate of change of a function, the derivative as the instantaneous rate of change, and the derivative as the rate of change function.
Modelling functions
Starting with models of informal real-life situations such as distance-time covariations, consistent with the historical context of discovery and invention of calculus, students were tasked to plot various functions in Sketchpad, leading to graphic and symbolic representations. Figure 1 shows the graph of y or f(x) = x2. An analysis of the figure shows that Sketchpad enabled the user to ‘plot the function’ and represent it both graphically and symbolically on the Cartesian plane. This is curve sketching made easy, and exacted at the click of a button. The software also enabled the user to plot a point on the graph. A further enablement is that such a plotted point (A) can be animated to trace or follow the path of the graphical representation.
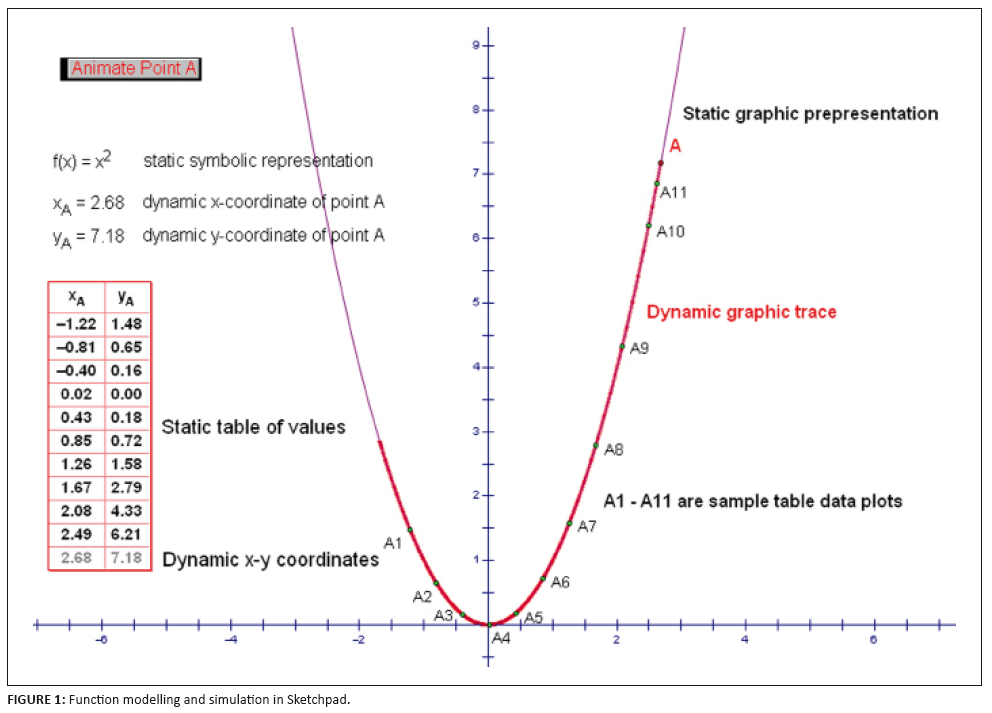 |
FIGURE 1: Function modelling and simulation in Sketchpad.
|
|
An organisation constraint of the animation is that it can only be seen within the visible range of values of the domain and co-domain or the viewing window. The scale of the viewing window can be varied by the user by means of a usage scheme (e.g. dragging point (1;0) on the x-axis) to perform a pragmatic function. In turn, by virtue of Sketchpad enablements the animation can be paused, reversed or resumed by the user – an instrumented action scheme performing an epistemic function of understanding the locus of the point being animated. More importantly, the coordinates of the plotted point can be plotted and a sample table of values created as the animation progresses, thus enabling a numeric representation. An internal constraint of Sketchpad regarding this numeric representation is that one cannot start with a table of values and then plot – the user is obliged in one way and impeached in the another way, the opposite direction. However, once such a sample table of values has been created, the points on it can be plotted on the graph (e.g. points A1 – A11 in Figure 1 were plotted from the table on the left). Again this appeared to be an internal constraint of Sketchpad, in the sense that the user is obliged to sample points first on an existing graph plotted apriori rather than the other way around – a familiar pencil-and-paper sequence. Overall, the enablements and affordances of Sketchpad software enable one to create a static graphic, static symbolic (algebraic), and static numeric (table of values) representations of the function on the one hand, and a dynamic graphic (animated point), dynamic symbolic (for curves or lines which vary their position), and dynamic numeric (table of values) representation on the other.
Modelling the average rate of change of a function
Commencing with informal real-life situations, such as average velocity, corresponding to the motion context of discovery and invention of the calculus as motivation, students were assigned function-plotting tasks in Sketchpad, leading to graphic and symbolic representations. Figure 2 shows the graph of y or f(x) = x2 + 1 with a secant line through points A and B. Sketchpad enables the user to construct a second point on a graph and to construct a line passing through the two points (A and B). Furthermore, it allows the user to measure or calculate the vertical (y-) and horizontal (x-) displacements between two plotted points on the Cartesian plane. This enables a step-by-step calculation of the slope of the straight line joining the two points; this enablement also appears to be a potentiality of Sketchpad. Alternatively, the slope of a straight line can be measured directly using an available command − both an affordance and a command constraint of Sketchpad, since this is what the artefact favours and can by nature do. In both cases the result is the same: the average rate of change of a function between any two points of its domain. When animated, the line becomes a continuous sequence of secants at different positions of the graph and the results can be tabulated, as shown in Figure 2.
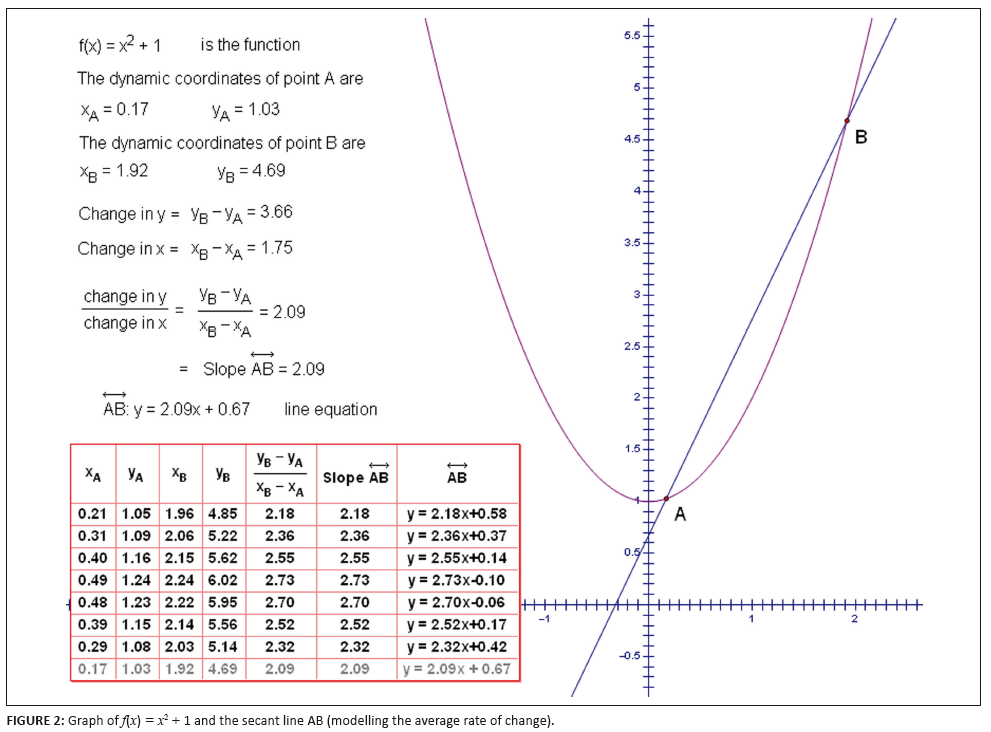 |
FIGURE 2: Graph of f(x) = x2 + 1 and the secant line AB (modelling the average rate of change).
|
|
In other words, Sketchpad potentially enables the user to create a static graphic, static symbolic (algebraic), and static numeric (table of values) representation of the secant on the one hand and a dynamic graphic (animated secant), dynamic symbolic (as the secant varies its position), and dynamic numeric (table of values) representation on the other – virtually opening up possibilities or potentialities for the user. These affordances and enablements of Sketchpad highlight the epistemic function of the associated instrumented action schemes or gestures oriented towards carrying out specific tasks.
Modelling the derivative as the instantaneous rate of change
Using real-life situations informally as a point of departure, such as speed at an instant, or at time of collision of objects as background, students (guided by didactic configuration of worksheets) were required to construct the tangent as the limit of the secant line in Sketchpad. This resulted in the graphic and symbolic representations shown in Figure 3.
 |
FIGURE 3: Modelling instantaneous rate of change in Sketchpad.
|
|
In addition to the enablements and affordances for representation of the average rate of change of a function described above, through its syntax-linked command constraints Sketchpad enables the user to move one point (B) to another point (A) along a graph (by dragging or via a self-created action button) or vice versa. The secant line joining the two points shifts accordingly and stops at the destination point as the tangent to the graph at that point (a potentiality). It does not matter whether B is dragged to A from above or from below – a convenient enablement. This opens up to the Sketchpad user the possibility or potentiality to dynamically create the tangent as a limit of a secant at any point: that is, as the rate of change of a function at any instant, leading to a construction of the instantaneous rate of change concept image of the derivative. This exemplifies instrumented action schemes performing an epistemic function. In other words, Sketchpad enables the user to create a static graphic, static symbolic (algebraic) and static numeric (table of values) representation of the tangent as a limit of the secant, on the one hand, and a dynamic graphic (animated secant as shown by path traced), dynamic symbolic (as the secant varies its position as shown by sample table readings), and dynamic numeric (sample table of values) representation, on the other. However, a command constraint or limitation of the representation capabilities is an apparent violation of the definition of a secant line when it becomes a tangent or when point B mathematically or precisely reaches point A. Theoretical-computational conflicts emerge, and require mathematical resolution and explanation. Giraldo and Carvalho (2002, p. 1) define a theoretical-computational conflict to be any situation in which a computational representation for a mathematical concept is, at least potentially, contradictory to the associated theoretical formulation. For example, in Figure 3,
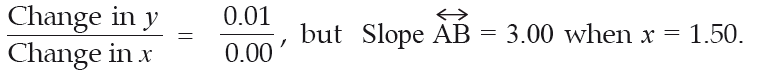
The conflicting differential quotient results were resolved by means of the teacher-researcher engaging in a didactic performance that initiated a whole-class discussion about the effect of increasing the precision of the decimal measure of the slope. This revealed that it was a rounded-off value to a limited number of decimal places, and the limit was then investigated from both above and below to arrive at an intuitive understanding of its existence – an epistemic function of the associated instrumented action scheme.
Modelling the derivative as the rate of change function
Starting with real-life situations, such as speed at any instant, as motivation, students worked on worksheets (didactic configuration) to represent the rate of change function as shown in Figure 4. Sketchpad enables the user to plot a point given its coordinates (enablement) and to trace that point as its coordinates change (enablement). If the x-values of point A are plotted against the slope values of tangent AB, point C is obtained (affordance). When the tangent is animated (enablement), point C follows a path that can be traced to represent the slope function of the original graph (potentiality). Alternatively, Sketchpad enables the user to find the symbolic derivative (an affordance or command constraint) and to plot its graph directly (an organisational constraint).
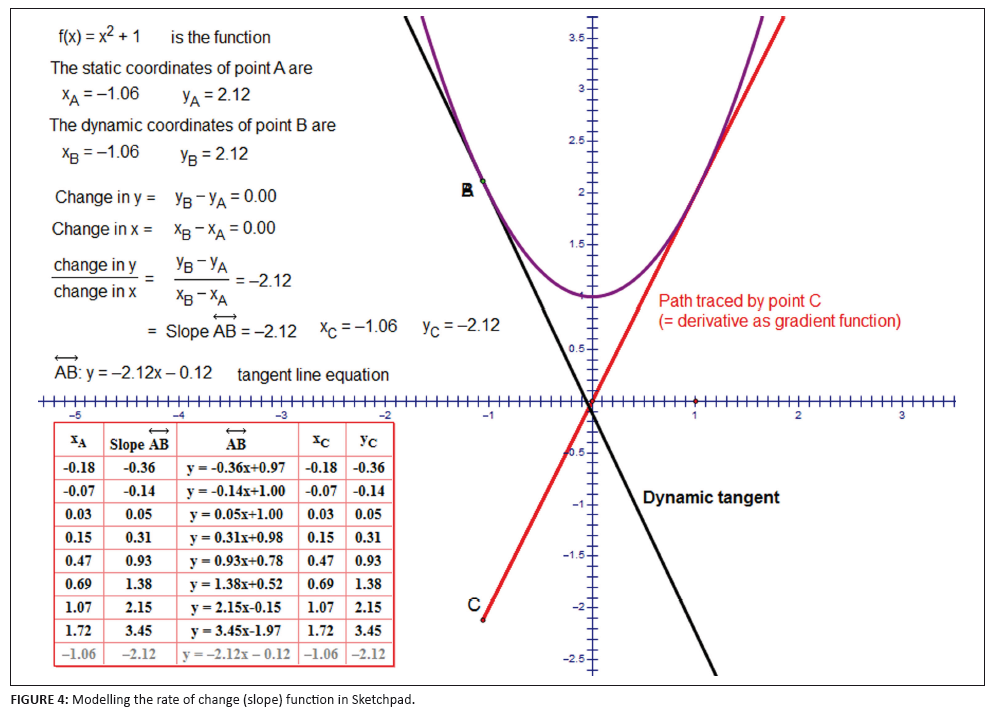 |
FIGURE 4: Modelling the rate of change (slope) function in Sketchpad.
|
|
In other words, Sketchpad enables the user to generate a static graphic, static symbolic (algebraic), and static numeric (table of successive coordinates of point C) representation of the tangent slope changes with respect to changes in x-values, on the one hand, and a dynamic graphic (animated tangent effect on point C as shown by the path traced) and dynamic numeric (last row of x-y table of values) representation, on the other. However, one organisation constraint of Sketchpad is that the tangent may disappear when animated, causing theoretical-computational conflicts that need to be resolved to merge the mathematics with the technology. A second (organisation) constraint is that the equation of the derivative can only be represented statically and a dynamic symbolic (algebraic) representation makes no sense. A third (command) constraint is that the symbolic derivative is given as an answer that does not show the steps used to arrive at it (which also makes it an organisation constraint).
Qualitative data in terms of some sample post-task interview protocols with individual students are now presented and then analysed. We use the notation TR for the teacher-researcher and students MT and DJ and so on for the individual students. Bold type, for example, Plot New Function, refers to commands in the Sketchpad drop-down menus as illustrated in Figure 5.
 |
FIGURE 5: Example of commands in the Sketchpad drop-down menu.
|
|
Modelling the function concept in Sketchpad
Post-task interview protocol for Student MT
A1. TR: Can you describe to me how you would plot a function in Sketchpad? Choose a function of your choice. [Instrumented action scheme]A2. MT: From the Graph menu I would select Plot New Function [an affordance] and define
 using the calculator keypad that appears [instrumented action scheme performing an epistemic function]. [MT demonstrated that on the computer and obtained the graph in Figure 6]
A3. TR: How would you represent the function in dynamic graphic form? [Enablement]A4. MT: I would first construct a point on the graph of
by highlighting the plotted graph of
[enablement] and choosing Point on Function Plot [affordance] from the Construct menu and animating or dragging the point. [Enablement] A5. TR: Do you mean Construct Point on Function Plot? A6. MT: Yes construct, not plot. A7. TR: What happens when you animate the constructed point? [Organisation constraint] A8. MT: The point follows the graph of the function. A9. TR: How do you create a table of values for
in Sketchpad? [Enablement] A10. MT: I select the plotted point and label it A [enablement], then select Abscissa (x) and Ordinate (y) from the Measure menu to display the coordinates. [Demonstrating Sketchpad affordance] A11. TR: How do you create the table after that? A12. MT: I select the values for xA and yA [enablement] and select Tabulate from the Graph menu to create a table of values for the two variables [organisation constraint]. Then animate and double-click the table as the point moves along the graph. [Demonstrating Sketchpad enablement] A13. TR: Are all the table data points visible on your graph? [Organisation constraint] A14. MT: Let me see, the point (-0.01; -130.77) appears to be out of sight. [Internal constraint of Sketchpad] A15. TR: What happened to the animated point when it disappeared at the bottom? A16. MT: It reappeared again at the top of the graph. [Internal constraint] A17. TR: What does that tell us about the values of y when x = 0? A18. MT: There is some connection between the large negative y-value and the large positive y-value yet the y-axis is an asymptote and there should be no values of y. [Theoretical computational conflict] A19. TR: Can you give examples of real-world situations that can be represented by the function you have chosen? A20. MT: Maybe the electrical resistance of a conductor which is inversely proportional to its size, or speed and time - the faster you run, the less time you take, etc.
Protocol analysis A
In the interview there was a satisfactory description of the Sketchpad affordances or favourable movement sequences for the instrumented action schemes
of defining and transforming a function from its static symbolic or algebraic form (A2). The static symbolic form,
,
entered in the calculator keypad (a built-in artefact of the software accessed by means of the usage scheme) was transformed into the static graphic visualization on the graphic interface (an organisation constraint of Sketchpad). The static graphic representation was transformed into a dynamic representation by constructing a point (A4), by means of a sequence of enablements and affordances (A6), on the function plot. This was a process of the student mastering of the artefact - instrumentalisation. The plotted or constructed point was successfully animated (A4), a potentiality enabled by Sketchpad, and observed to follow the static graphical representation as its locus (A8) – an organisation constraint linked to the interface between the artefact and the user. This was a powerful conceptual development potential of the software in that it demonstrated continuity as an important property of the function. However, the continuity of the function was violated when the animated point disappeared at the bottom (A14) and reappeared at the top of the y-axis, the asymptote, as if there was no break in movement (A16) – an internal constraint of the artefact induced by the limited viewing window. A probing of the anomaly by the teacher (a didactical performance) provided an opportunity for the student to reconcile with the fact that the graph was undefined at x = 0 (A17). This suggested that there could be deep mathematical understandings created by a discussion and resolution of the apparent theoretical-computational conflicts. Regarding the care needed when using software as a generator of mathematical concepts, Noble, Nemirovsky, Wright and Tierney (2001, p. 87) remind us that mathematical concepts reside not in physical materials but in what students do and experience. Similarly, the ability to make connections between representations (instrumental genesis) clearly lies outside the materials themselves, but can be enhanced or inhibited by the teacher’s instrumental orchestration strategies − exploitation modes in particular. We can only gain access to the connections the learner makes by focusing his or her attention on the meanings attached to the mathematical relationships in the activity they are undertaking – the epistemic function of their instrumented action schemes. It is clear that whereas MT was able to make interconnections between the multiple representations and to link the inverse function informally to some real-life situations, there were still some command and organisation constraint problems to contend with.
Modelling the average rate of change of a function
Post-task interview protocol for Student TM
B1. TR: Can you describe to me how you would use Sketchpad to demonstrate, calculate or measure the average rate of change of a function between any two points of its domain? [Potentiality of Sketchpad]B2. TM: Firstly select the function [enablement] and choose Plot Point on Function from the Construct menu, twice, to plot two points on the graph of the function. [Affordance] B3. TR: Is it Plot Point or Construct Point on Function Plot? [Didactic performance] B4. TM: Thank you for that correction, it should be Construct, not Plot. [Command constraint] B5. TR: That’s OK, you can proceed. B6. TM: Then select the points [affordance] and choose label points from the Display menu to label the left point and the point on the right. [Affordance] B7. TR: Can you demonstrate to me how you would construct a secant line in Sketchpad? [Potentiality] B8. TM: Choose Line from the Construct menu to construct a line passing through the highlighted points, and this is the secant line. [Instrumented action scheme supported by an enablement – choice of menu, and an affordance – favoured menu command] B9. TR: How would you find the slope/gradient of the secant line in Sketchpad? [Didactic performance of prompting an instrumented action scheme in the student] B10. TM: To find the slope in Sketchpad I will select the secant line [an enablement] and choose Slope from the Measure menu [an affordance]. [Syntax] B11. TR: How would you find the equation of the secant line in Sketchpad? [Didactic performance] B12. TM: I would select Equation from the Measure menu, instead of Slope, this time. [An affordance] B13. TR: How would you explain to a friend what this gradient represents? [Mathematical concept] B14. TM: I can say change in y-values divided by change in x-values. B15. TR: How can you express the slope symbolically? B16. TM: To symbolically express the gradient, let there be two points A and B such that their coordinates are (x1;y1) and (x2;y2). Then secant line gradient
=  Potentiality]
 B17. TR: Could this be the same as
 ? [Didactic performance] ? [Didactic performance] B18. TM: Yes, if we substitute y2, y1, x2, and x1 for f(x+h), f(x), (x+h) and x respectively. B19. TR: What happens when the secant line is animated? B20. TM: The coordinates for points A and B, the slope and equation of the secant line all change as the animation goes on. [Organisation constraint] B21. TR: Can you give real-world examples of the average rate of change? B22. TM: Average speed of a bus from Bulawayo to Gwanda on its way to Beit Bridge or any two points of its journey.
Protocol analysis B
TM started with the selection of the graph of the function, an enablement, and the construction of two points on the function plot (B2) – an affordance of Sketchpad on the Construct Menu favoured by the sequence of software manipulations. There were, however, some semantic conflicts and difficulties – a command constraints problem. The ‘Construct Point’ command was referred to as ‘Plot Point’ (B4). There was some inconsistency between the traditional paper-and-pencil mathematical language, where a point is ‘plotted’ not ‘constructed’, and Sketchpad mathematical language. In his narrative the student seemed to be rationalizing this terminological debacle. However, it was clear that the task was to construct two points (B8) on the graph (Function Plot) first - an instrumented action scheme supported by a Sketchpad enablement (choice of Menu) and an affordance (favoured menu command). The labelling of points was optional and therefore an enablement making the user able to do something.Through his didactic performance the teacher prompted the student to employ an instrumented action scheme for finding the slope of the secant in Sketchpad (B9). The student was able to select the secant (enablement) and to choose Slope (an affordance) from the Measure menu (B10). Similarly, the student was able to find the equation of the secant using the relevant Sketchpad affordances (B12). In other words, the student started with a graphic representation of the secant (an organisation constraint) and proceeded to the numeric slope (an affordance), which he then expressed symbolically as a differential quotient (B16). The combination of representations amounted to a potentiality of Sketchpad, in that it was not a given but a possibility. The results of the animation (enablement and affordance) gave rise to various average rates of change as the secant slid along the function plot (a command constraint). The activity thus gave students options of representing the average rate of change as a measure of slope or as a method of calculating, and as a variable measure dependent on any two points on the graph.
Modelling the derivative as the instantaneous rate of change
Post-task interview protocols for students TM and DJ
These two students were interviewed separately, but for convenience their responses are given together below.C1. TR: Can you describe to me how you would use Sketchpad to demonstrate/calculate the slope of a graph at a given point of its domain? [A potentiality supported by an instrumented action scheme] C2. TM: By drawing a tangent line through that point by choosing Line from the Construct menu [command constraint]. To calculate slope using Sketchpad, I select the tangent line through given point [enablement], then I choose Derivative from the Graph menu. [Command constraint error for this student] C20. DJ: Drawing a tangent through that point by choosing Line from the Construct menu [enablement]. To calculate slope using Sketchpad, I select the tangent line through the given point [enablement], then I choose Slope from the Measure menu [affordance]. It will then be shown on the screen. [Organisation constraint error] C3. TR: Can you show me how to construct a tangent line when given a secant line in Sketchpad? [Teacher’s didactic performance] C4. TM: By selecting point B and dragging it towards point A it’s the rate of change of function at that point. [Enablement] C22. DJ: By creating an action button to move point B to point A to form a tangent at A. It’s the slope of the function at that point A. [See Figure 7]
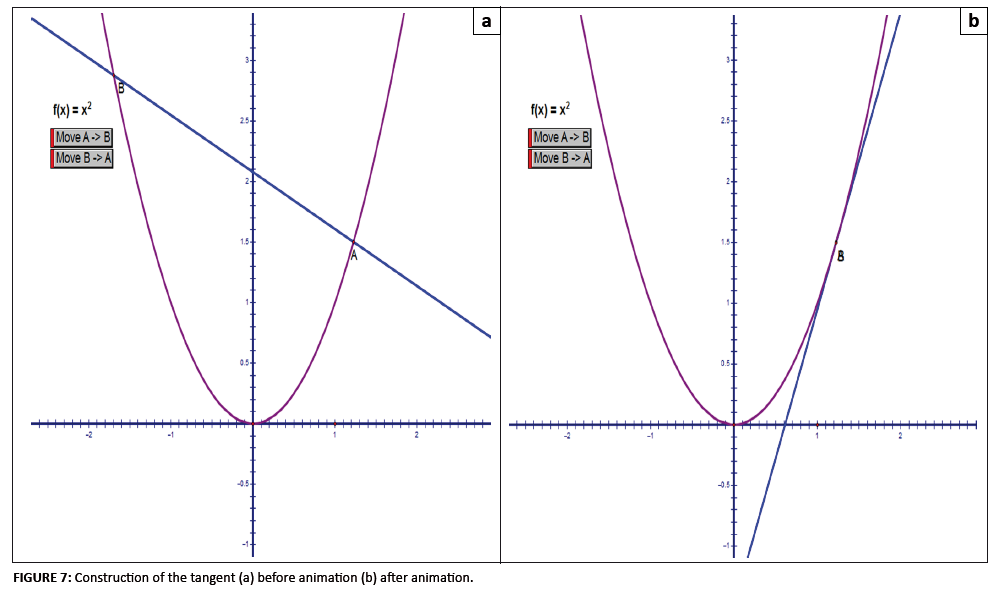 |
FIGURE 7: Construction of the tangent (a) before animation (b) after animation.
|
|
C5. TR: What is the value of the gradient of the tangent line at the point of contact?C6. TM: This refers to the increase in y divided by increase in x of a tangent. [Instrumental genesis] C25. TR: Is it always an increase? [Didactic performance] C26. DJ: No…. C7. TR: Can you explain the meaning of the value of the gradient of the tangent at a point? [Didactic performance] C8. TM: Instantaneous rate of change at that point. C9. TR: Is the value always positive, negative or both? [Didactic performance] C10. TM: The value of the gradient on a graph can be positive, negative or non-negative. C30. DJ: No. C11. TR: Can you explain your answer? [Didactic performance] C12. TM: It cannot be both positive and negative at the same time. C32. DJ: It can be negative if x- and y- are changing in opposite directions but cannot be both positive and negative at the same time. C13. TR: Can you give real-world examples of the instantaneous rate of change? [Didactic performance] C14. TM: Speed at an instant. C34. DJ: Speed at point of impact in a car accident. C15. TR: How would you express the gradient of the tangent symbolically as a limit of the secant line gradient? C16. TM:  [Mathematical understanding]
 C36. DJ: limB → A Gradient of secant = gradient of tangent C17. TR: Is there any other way of expressing the limit? C18. TM:  [Note error]
 C38. DJ:
Protocol analyses C
The demonstration and calculation of the slope of a graph at a given point was a potentiality which Sketchpad availed, requiring execution of the appropriate instrumented action schemes (C1). Both TM and DJ incorrectly explained that they would ‘draw a tangent line’ in Sketchpad by choosing Line from the Construct menu (an indication of command constraints). Their descriptions were more like paper-and-pencil than Sketchpad methods. TM was unable to calculate the slope unaided, due to the use of an incorrect menu command (C2), a command constraint, and proceeded to find the ‘Derivative of the tangent line’ in Sketchpad (C2) – another command constraint. However, DJ was able to measure the slope of a given line (tangent) by selecting or highlighting the line (enablement) and choosing an appropriate command in the Measure menu to measure the slope (an affordance favoured or privileged by the menu) (C20). In both cases the difficulties encountered were technical, in that the students were not able to operate the software in the intended way (Mehanovic, 2011), an indication that they were still in the process of mastering the software (instrumented action schemes in their instrumentalisation process) to accomplish their instrumental genesis. The second question of the interviews (C3 and C21) redirected the students towards using the secant line as the starting point. This redirection evidenced the teacher-researcher’s instrumental orchestration efforts through the exploitation mode of didactic performance. Eventually both students constructed two points, a secant joining the two lines, and dragged one point (B) towards the other (point A) (C4) or used an action button to obtain the tangent by animating point B to point A (instrumented action schemes) (C22). This led to a dynamic graphic illustration of the tangent as the limiting position of the secant to represent the instantaneous rate of change, as in Figure 7 (an organisation constraint linked to the interface/viewing window as well as a potentiality made possible by Sketchpad).
Modelling the derivative as the rate of change function
Interview protocols for students TM and MN
D1. TR: In Sketchpad, how would you construct the graph of the function showing how the tangent gradient changes with respect to x? [Potentiality of Sketchpad to be supported by appropriate instrumental action schemes]D2. TM: I would start by selecting the gradient [enablement] and measuring its slope [affordance], and then isplaying its x-coordinates using the Slope and Abscissa commands. [An enablement within the command constraints] D14. MN: I would follow Activity C, select f(x) = x2 and display the algebraic derivative using the Derivative command [an affordance] and then plot it using the Plot Function command from the Graph menu. [An affordance favoured by Sketchpad] D15. TR: What does the plotted function represent? [Didactic performance] D16. MN: The function plotted represents the gradient at any point. [Epistemic function of the instrumented action schemes] D3. TR:How would you plot the slope of the tangent line against the x-values in Sketchpad? D4. TM: Select the slope and the abscissa and choose Plot as (x,y) from the Graph menu. Point C is plotted. [Potentiality achieved through appropriate enablements – selection, and affordances - plotting] D18. MN: Move point B to point A using the action button [instrumented action scheme]. Plot x against slope as (x,y). That is, point C [see Figure 8]. Select point C and choose Trace Point from the Display menu [an enablement followed by an affordance]. Deselect everything and select line AB [tangent] and select Animate Line from the Display menu [heavy demand on syntax – command constraint]. The path taken by point C represents the gradient of the function at any point. [Potentiality] [Attention can be easily drawn away from the mathematical to the syntactical processes – command constraints]
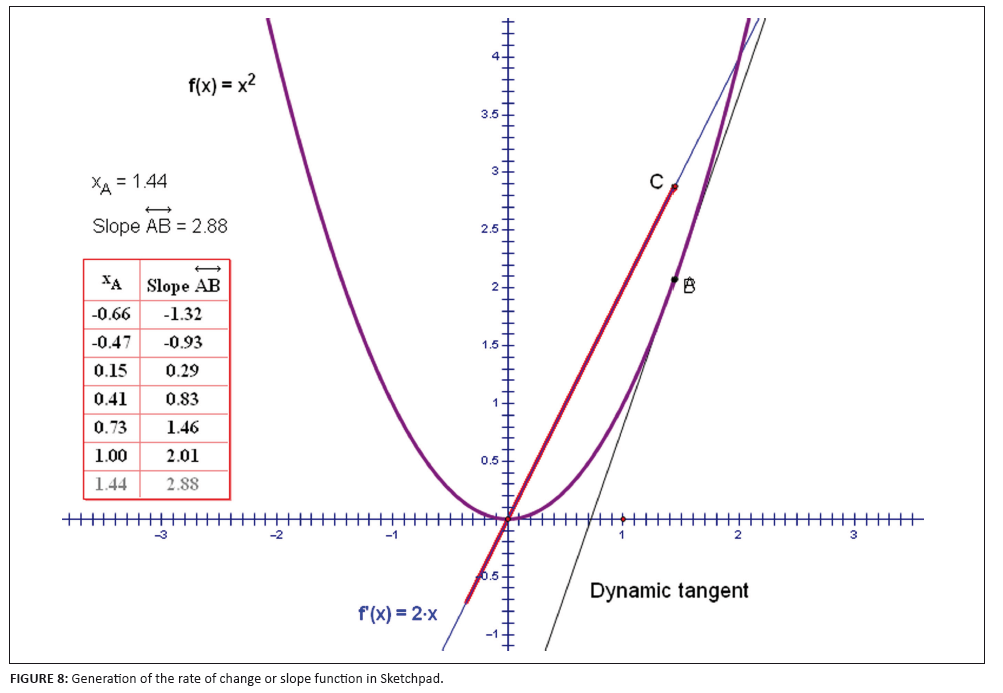 |
FIGURE 8: Generation of the rate of change or slope function in Sketchpad.
|
|
D5. TR: If you trace Point C and animate the tangent, what pattern is the path traced by the plotted point? [Didactic performance]D6. TM: It’s a straight line. [Organisation constraint] D20. MN: The path traced by C is a straight line. D7. TR: How would you represent this path numerically in Sketchpad? [Didactic performance] D8. TM: Constructing a table of values and clicking repeatedly to enlarge it during animation. [Enablements] D22. MN: Select Abscissa (x) and Ordinate (as slope of AB). From the Graph menu, select Plot as (x, y). Tabulate x and slope values to form a table of values. [Enablements] D9. TR: How can you express the function (path) symbolically as a limit of the differential quotient for the general point on the graph of f(x)? [Mathematical meaning of the instrumented action scheme] D10. TM: Limit x everywhere:
D24. MN: 
D25. TR: How can you verify your findings in the previous step using Sketchpad? [Instrumentation] D12. TM: Choosing Derivative from the Graph menu, as we did in the first step. [Affordance] D26. MN: Select the function label f(x) = x2 [enablement] and the Derivative command from the Graph menu. [Affordance] Select Plot Function from the Graph menu to plot the graph of the derivative. [Affordance]
Protocol analysis D
The teacher-researcher requested the performance of a potentiality of Sketchpad task that needed to be supported by appropriate instrumented action schemes. TM started by selecting the tangent drawn in the previous activity (C) (a time-saving affordance of Sketchpad), and made the appropriate selection of an abscissa (x) and tangent slope value for the point of tangency, point A (D2) – an enablement. He then plotted point C using the Graph menu (an affordance of Sketchpad when two points have been selected). MN also started with work in activity C and specified the function whose tangent was under investigation to be f(x) = x2. However, he selected the Derivative command from the Graph menu straight away (D14) (an affordance of Sketchpad when a differentiable symbolic function is selected) and proceeded to plot the derivative (an affordance) employing appropriate instrumented action schemes. He was also clear that the function represented the derivative as the gradient at any point on the graph (D16). It was evident that MN took advantage of the recently introduced Sketchpad shortcut to find and draw the derivative of a function, even though this was a less illuminating or ‘non-transparent’ characteristic of software, reminiscent of the ‘black box’ and flashcard metaphors of technology use (Drijvers, 2000; Cuoco & Goldenberg, 1996). However, the use of a shortcut signified the extent to which MN had mastered the software – an instrumentalisation process – and how, in turn, he was being influenced by the instrument in his solution strategies – an instrumentation process. Differences in the progress the individual students had made highlighted the idiosyncratic nature of student experiences of and adaptation to the software environment. The idiosyncratic experiences have implications for the didactic configurations – specific arrangements of the artefactual environment, and the exploitation modes of these configurations in the teacher’s instrumental orchestrations (Guin & Trouche, 2005, p. 1022). TM was able to plot the tangent slope against the x-coordinate (or abscissa) of the point of tangency (D4). He managed to trace point C (an enablement) and to animate the tangent (D6) (an enablement). MN, on the other hand, was more precise about the tracing and animation commands and appeared more conversant with what the trace represented (D18) − again a sign of growing fluency in his instrumental genesis processes. The uneven growth in fluency in instrumental genesis processes has implications for the teacher’s instrumental orchestration: students might take time to be familiar with the orchestration of new tools and teachers need to be patient with them, at least in the initial stages. However, both students managed to recognise the pattern of the trace to be a straight line graph (D6 and D 20). Both were also able to form sample tables of values (D8 and D22) – enablements − but once again, MN was more elaborate in explaining the Sketchpad command constraints or complex syntax involved (D22). Expressing the path of C algebraically as a limit of the differential quotient was performed correctly (D10 and D24). However, TM’s solution was more accurate (D10). The verification of the derivative using Sketchpad was not problematic to execute (an affordance). However, the absence of a solution procedure meant that Sketchpad acted algebraically as a flashcard or black box, as alluded to above – a giver of answers (an internal constraint). Because of this propensity, Cuoco and Goldenberg (1996, p. 15) observe that computers are often used badly, in a manner which does not creatively tap the capabilities of either the computer or the learner.
The purpose of this study was to investigate how, if at all, Sketchpad could be used to enhance students’ mathematical understanding of the derivative in introductory calculus, and to obtain qualitative feedback from students in the experimental group regarding their experiences. The findings suggest that the introduction of technology into the classroom requires instrumental orchestration skills from the teacher, with which to facilitate the processes of instrumental genesis amongst learners. The qualitative results suggest that provided with individual computers and worksheets, learners can work collaboratively to achieve a reasonable understanding of the mathematical concepts at stake. However, the pace of learners’ appropriation proficiency of the artefact for mathematical understanding – instrumental genesis – can vary from learner to learner. The findings are consistent with earlier studies, such as those of Roddick (2001), Ellison (1994), Queseda (1994), Kendal and Stacey (2001) for learning environments involving CAS which have similar symbolic algebra capabilities to Sketchpad. The additional interest in this study was on the extended potential of dynamic mathematics environments that combine both CAS and dynamic graphic capabilities. There is a need to constantly reconcile the occasional tension experienced between paper-and-pencil methods and meanings on the one hand and the software meanings and methods for the same constructs and concepts on the other. Technology cannot orchestrate itself to articulate mathematical understandings to learners; the human instructional agent remains indispensible in appropriating the artefact to accomplish specific didactic goals and purposes. This has implications for curriculum design and software programming. The study needs to be replicated with improved materials, larger class sizes, more implementation time available, and a wider scope of calculus concepts. We therefore cautiously conclude that a careful use of dynamic mathematics software promises some potential to improve the conceptual understanding of mathematics concepts in general and calculus in particular. That potential cannot be realised unless explored and documented carefully.
Limitations of the study
The limitation of this study is that the results cannot be generalised since the number of students was limited. The fact that students were able to progress at different paces suggested that they had idiosyncratic experiences that would be impossible to replicate. To enhance the reliability of the feedback, the same questions were used in the structured post-task interviews, in as much as the same worksheets were used for all learners. To enhance both the internal and external validity of the study, the interview questions were based on the worksheets to ensure correspondence. The replicability of the study is also dependent on the teacher-researcher’s fluency with Sketchpad use.
The initial research was partly funded by the University of South Africa under a postgraduate bursary scheme. However, the opinions expressed do not necessarily reflect the views of the university.
Competing interests
M.d.V. is a South African agent for Key Curriculum Press, promoting and selling Sketchpad software and curriculum materials. However, the software capabilities and possibilities discussed in this article are not limited to Sketchpad but are shared by most dynamic geometry software programs, including some freeware. The authors declare that this interest did not in any way influence them in writing this article, and that their intension is not to promote Sketchpad specifically, but to promote all dynamic geometry software and CAS programs as vehicles for teaching and learning mathematics.
Authors’ contributions
M.N. was the teacher-researcher responsible for experimental and project design as well as the writing of the manuscript. D.W and M.d.V. as first and second promoters respectively shared their expertise during the main study and during the development of the manuscript.
Artigue, M. (2002). Learning mathematics in a CAS environment: The genesis of a reflection about instrumentation and the dialectics between technical and
conceptual work. International Journal of Computers for Mathematical Learning, 7, 245–274.
http://dx.doi.org/10.1023/A:1022103903080Borwein, J. (in press). Exploratory experimentation: Digitally-assisted discovery and proof. In G. Hanna, & M. de Villiers (Eds.), Proof and proving
in mathematics education. Heidelberg: Springer-Verlag. Cobb, P., Confrey, J., diSeiza, A., Lehrer, R., & Schauble, L. (2003). Design experiments in educational research. Educational Researcher,
32(1), 9–13. Available from
http://www.aera.net/uploadedFiles/Journals_and_Publications/Journals/EducationalResearcher/3201/3201_Cobb.pdf,
http://dx.doi.org/10.3102/0013189X032001009 Cuoco, A.A., & Goldenberg, E.P. (1996). A role for technology in mathematics education. Journal of Education, 178(2), 15–32. Department of Basic Education. (2011). Curriculum and assessment policy statements: Mathematics Grades 10−12. Pretoria: Department of
Basic Education. Available from
http://www.education.gov.za/LinkClick.aspx?fileticket=KUOHTvTuVrk%3d&tabid=420&mid=1216 Drijvers, P. (2000). Students encountering obstacles using CAS. International Journal of Computers for Mathematical Learning, 5, 189−209.
http://dx.doi.org/10.1023/A:1009825629417 Drijvers, P. (2002). Learning mathematics in a computer algebra environment: Obstacles are opportunities. ZDM: The International Journal on
Mathematics Education, 34(5), 221−228. http://dx.doi.org/10.1007/BF02655825 Drijvers, P., Doorman, M., Boon, P., Reed, H., & Gravemeijer, K. (2010). The teacher and the tool: Instrumental orchestrations in the technology-rich
mathematics classroom. Educational Studies in Mathematics, 75, 213−234.
http://dx.doi.org/10.1007/s10649-010-9254-5 Ellison, M. (1994). The effect of computer and calculator graphics on students’ ability to mentally construct calculus concepts. Unpublished doctoral
dissertation. University of Minnesota, Minnesota, USA 1993. Dissertation Abstracts International, 51/11, 4020. Goldin, G.A. (1997). Observing mathematical problem-solving through task-based interviews. Journal for Research in Mathematics Education. Monograph Vol.
9, Qualitative Research Methods in Mathematics Education, 40−62. Available from
http://www.jstor.org/stable/749946 Giraldo, V., & Carvalho, L.M. (2002). Theoretical-computational conflicts and the concept image of derivative. In S. Pope (Ed.), Proceedings of the
British Society for Research into Learning Mathematics (pp. 37−42). Available from
http://www.bsrlm.org.uk/IPs/ip22-3/BSRLM-IP-22-3-7.pdf Gravemeijer, K.P.E. (1994). Developing Realistic Mathematics Education. Utrecht: Freudenthal Institute. Guin, D., & Trouche, L. (1999). The complex process of converting tools into mathematical instruments: The case of calculators. International
Journal of Computers for Mathematical Learning, 3(3), 195–227.
http://dx.doi.org/10.1023/A:1009892720043 Guin, D., & Trouche, L. (2002). Mastering by the teacher of the instrumental genesis in CAS environments: Necessity of instrumental orchestrations.
ZDM: The International Journal on Mathematics Education, 34(5), 204−2011.
http://dx.doi.org/10.1007/BF02655823 Guin, D., & Trouche, L. (2005). Distance training, a key mode to support teachers in the integration of ICT? Towards collaborative conception of living
pedagogical resources. In B. Barzel, P. Drijvers, M. Machiietto, & L. Trouche (Eds.), Proceedings of the 4th CERME Conference (pp. 1020−1030).
Sant Feliu de Guixols, Spain: IQS Fundemi Business Institute. Available from
http://telearn.archives-ouvertes.fr/hal-00190086/fr/ Haspekian, M. (2005). An “instrumental approach” to study the integration of a computer tool into mathematics teaching: The case of spreadsheets.
International Journal of Computers for Mathematical Learning, 10,
109−141. http://dx.doi.org/10.1007/s10758-005-0395-z Jenson, R.J., & Williams, B.S. (1992). Technology: Implications for the middle grades. In D.T. Owens (Ed.), Research ideas for the classroom:
Middle grades mathematics (n.p.). New York, NY: Macmillan Publishing. Kendal, M., & Stacey, K. (2001). The impact of teacher privileging on learning differentiation with technology. International Journal of Computers for
Mathematical Learning, 6(2), 143−165.http://dx.doi.org/10.1023/A:1017986520658 Lagrange, J.B. (2000). L’inte´gration d’instruments informatiques dans l’enseignement: Une approche par les techniques. Educational
Studies in Mathematics, 43(1), 1–30.http://dx.doi.org/10.1023/A:1012086721534 Lagrange, J.B., & Monaghan, J. (2009, January−February). On the adoption of a model to interpret teachers’ use of technology in mathematics
lessons. Paper presented at the CERME6 Conference, Lyons, France. Available from
http://www.inrp.fr/publications/edition-electronique/cerme6/wg9-08-lagrange.pdf Mehanovic, S. (2011). The potential and challenges of the use of Dynamic Software in upper secondary mathematics: Students’ and teachers’
work with integrals in Geogebra based environments. Linkoping, Sweden: Linkoping University. Available from
http://liu.diva-portal.org/smash/get/diva2:421408/FULLTEXT01 Ndlovu, M. (2008). Modeling with Sketchpad to enrich students’ concept image of the derivative in introductory calculus: Developing domain specific
understanding. Unpublished doctoral dissertation. University of South Africa, Pretoria, South Africa. Ndlovu, M., Wessels, D.C.J., & De Villiers, M.D. (2010). Modeling with Sketchpad to enrich students’ concept image of the derivative. In M.D. de
Villiers (Ed.), Proceedings of the 16th Annual Congress of the Association for Mathematics Education of South Africa, Vol. 1 (pp. 190−210). Durban:
AMESA. Available from http://www.amesa.org.za/amesa2010/ Noble, T., Nemirovsky, R., Wright, T., & Tierney, C. (2001). Experiencing change: The mathematics of change in multiple environments. Journal for
Research in Mathematics Education, 32(1), 85−108. http://dx.doi.org/10.2307/749622 Noss, R., & Hoyles, C. (1996). Windows on mathematical meanings: Learning cultures and computers. Dordrecht: Kluwer Academic Publishers.
http://dx.doi.org/10.1007/978-94-009-1696-8 Pierce, R., & Ball, L. (2009). Perceptions that may affect teachers’ intention to use technology in secondary mathematics classes. Educational
Studies in Mathematics, 71(3), 299–317.http://dx.doi.org/10.1007/s10649-008-9177-6 Quesada, A.R. (1994). What graphing calculators can do for college students: A recount of an experiment! In L. Lum (Ed.), Proceedings of the Sixth Annual
International Conference on Technology in Collegiate Mathematics (pp. 683−688). Reading, MA: Addison Wesley. Robert, A., & Rogalski, J. (2005). A cross-analysis of the mathematics teacher’s activity. An example in a French 10th-grade class. Educational
Studies in Mathematics, 59, 269–298.http://dx.doi.org/10.1007/s10649-005-5890-6 Roddick, C. (2001). Differences in learning outcomes: Calculus and Mathematica vs traditional calculus. Primus, 11(2), 161−184.
http://dx.doi.org/10.1080/10511970108965986 Simon, M.A. (1995). Reconstructing mathematics pedagogy from a constructivist perspective. Journal for Research in Mathematics Education, 26(2),
114−145. http://dx.doi.org/10.2307/749205 Skemp, R. (1976). Relational understanding and instrumental understanding. Mathematics Teaching, 77, 20−26. Steffe, L.P., &, Thompson, P.W. (2000). Teaching experiment methodology: Underlying principles and essential elements. In R. Lesh, & A.E. Kelly (Eds.),
Research on design in mathematics and science education (pp. 267–307). Hillsdale, NJ: Lawrence Erlbaum. Tall, D.O. (1997). Functions and calculus. In A. Bishop, K. Clements, C. Keitel, J. Kilpatrick, & C. Laborde (Eds.), International handbook of mathematics
education (pp. 289−325). Dordrecht: Kluwer Academic Publishers. Trouche, L. (2003, June). Managing the complexity of human/machine interaction in a computer based learning environment: Guiding student’s process
command through instrumental orchestrations. Communication presented at CAME 3: Learning in a CAS Environment: Mind-Machine Interaction, Reims, France.
http://dx.doi.org/10.1007/s10758-004-3468-5 Trouche, L. (2004). Managing the complexity of human/machine interactions in computerized learning environments: guiding students’ command process through
instrumental orchestrations. International Journal of Computers for Mathematical Learning, 9(3), 281–307.
http://dx.doi.org/10.1007/s10758-004-3468-5 Verillon, P., & Rabardel, P. (1995). Cognition and artifacts: A contribution to the study of thought in relation to instrumented activity. European
Journal of Psychology of Education, 10(1), 77–101.http://dx.doi.org/10.1007/BF03172796 Wu, H. (1999). On the education of mathematics majors. In E.A. Gavasto, S.G. Krantz, & W. McCallum (Eds.), Contemporary issues in mathematics education
(pp. 9−23). New York, NY: Cambridge University Press.
1.The term ‘instrumental’ should not be confused with Skemp’s (1976) use of the terms ‘instrumental’ and ‘relational’
understanding.
|
