|
Poor Trends in International Mathematics and Science Study (TIMMS) results and widespread disappointing mathematics results in South Africa necessitate research-based and more efficient professional development for in-service mathematics teachers. This article reports on the profiling of mathematics teachers’ statistical knowledge, beliefs and confidence in order to inform the development of in-service teacher education programmes in statistics for Grade 8 and Grade 9 teachers. Ninety mathematics teachers from schools with culturally diverse learner populations in an urban region in South Africa were profiled using an adapted profiling instrument (Watson, 2001). Although statistics formed part of quite a number of these teachers’ initial teacher education and about half of them were involved in professional development in statistics education, they still teach traditionally, rather than using a more data driven approach. Teachers indicated high levels of confidence in teaching most statistics topics but showed low levels of statistical thinking when they had to apply their knowledge of concepts, such as sample and average in social contexts including newspaper articles and research reports.
In South Africa, as in many other countries, many mathematics teachers lack a sound grounding in statistics (North & Scheiber, 2008; North & Zewotir, 2006; Wessels, 2008, 2009). This lack of grounding limits their confidence and competence in teaching data handling and probability and subsequently they are not able to teach their learners to become statistically literate. A series of professional development initiatives in statistics education started in South Africa when the Sixth International Conference on Teaching Statistics (ICOTS6) was held in the country in 2002. These initiatives were strengthened when the national statistics office (Statistics SA) provided financial assistance for professional development in statistics education by launching the Maths4Stats campaign in 2006 (North & Scheiber, 2008). Despite this drive to improve statistics education in the country, many high school teachers still did not have any exposure to professional development in statistics by 2008 (Wessels, 2009). In many cases professional development in statistics education was focused on Grade 10–12 teachers, whilst statistics teaching in the lower grades did not receive enough attention. From discussions with teachers it was clear that because of minimal exposure to statistics in their initial training and later in their career, many of the Grade 8 and Grade 9 teachers lacked statistics content knowledge and pedagogical content knowledge. This lack of knowledge had an effect on the preparation of learners in Grade 8 and Grade 9 and consequently on the readiness of learners for the statistics done in Grade 10–12. The need for professional development in statistics education, specifically for Grade 8 and Grade 9 statistics teachers, is therefore all too clear.The design of professional development initiatives in statistics education for teachers should be informed by research (Borko, 2004; Corcoran, 1995; Ingvarson, Meiers & Beavis, 2005; Shaughnessy, 2007; Sowder, 2007). Corcoran (1995) comments on the fact that in the past not enough attention was given to the planning of professional development and that the urgent need for effective professional development necessitates a focused approach: if today’s teachers are to be adequately prepared to meet the new challenges they are facing, this laissez-faire approach to professional development must come to an end. The needs are too urgent and resources too scarce to simply continue or expand today’s inefficient and ineffectual arrangements. (Corcoran, 1995, p. 1) Very little research has been documented about the statistical content knowledge and pedagogical content knowledge of South African teachers, their beliefs about statistics, their confidence to teach different statistics concepts and their levels of statistical thinking (Wessels, 2009).
Classroom practices, teacher knowledge, beliefs and confidence
Ingvarson, Beavis, Bishop, Peck and Elsworth (2004) identified a number of crucial factors impacting on teacher effectiveness, including knowledge of the subject, pedagogical content knowledge, the organisation and application of this knowledge, teacher beliefs about teaching and mathematics, knowledge of the development of higher order thinking skills, and to a lesser degree, qualifications. It is interesting to note that experience was not found to have a significant impact on effective teaching but that classroom practices directly impacted on student outcomes. According to Ingvarson et al. (2004) these practices: are reciprocally related to the teachers’ knowledge, beliefs and understandings. These in turn are shaped by the school and their educational and professional development experiences, as well as school system factors. (Ingvarson et al., 2004, p. 23, 71) The crucial role that teachers’ knowledge as well as beliefs and confidence play in their practice necessitates further discussion of these aspects. Teacher knowledge is a multifaceted concept. Schulman (1987) identified seven different kinds of teacher knowledge necessary for effective teaching, including content knowledge, pedagogical content knowledge, curriculum knowledge, knowledge of students and their characteristics, knowledge of educational contexts, and knowledge of education ends, purposes and values. Ball, Thames and Phelps (2008) have identified two essential categories of knowledge: subject matter knowledge and pedagogical content knowledge. They divide subject matter knowledge into common content knowledge, specialised content knowledge and knowledge at the mathematical horizon, whilst pedagogical content knowledge includes knowledge of content and students, knowledge of content and teaching, and knowledge of curriculum. Burgess (2010) emphasises that these different knowledge variables are closely connected and do not act in isolation from each other. Beliefs and confidence are important facets of teacher capacity. Teacher beliefs about mathematics, teaching, students’ mathematical thinking, mathematics curricula, technology and gender play an important role in shaping their classroom practices and have to be taken into account when considering teacher practices (Ambrose, 2004; Philipp, 2007; Remillard & Bryans, 2004; Staub & Stern, 2002). Graven (2004) argues that the development of confidence in mathematics ‘enables and supports mathematical learning necessary for ongoing professional development within mathematics education’ (p. 181). School enabling conditions, such as school leadership, the professional learning community at the school, the availability of technical resources, and programme coherence also impact on teacher efficacy (Ingvarson et al., 2004).
Profiling teachers
In order to plan meaningful professional development in statistics education for teachers, it is necessary to build a picture of their strengths and needs in the teaching of statistics. This picture should include information about their knowledge, beliefs, confidence, education and experience. The assessment of teacher knowledge is a controversial issue, but it is possible and necessary: Measuring teacher knowledge, even using standardised modes of assessment, can be done in ways that honor and define the work of teaching, ratify teachers’ expertise, and help to ensure that every child has a qualified teacher. (Hill, Sleep, Lewis & Ball, 2007, p. 150) Obtaining information to create a comprehensive picture of all facets that contribute to effective teaching requires multiple approaches. Written assessments, including open-ended questions, interviews and classroom observation by trained interviewers and observers, discourse analysis, and teacher reflections are some of the approaches that could form part of the generation of a complete picture of teacher knowledge, beliefs and competencies (Hill et al., 2007; Schulman, 1987; Watson 2001). Watson (2001) argues that although it is desirable to use all the different approaches of gathering information about teacher knowledge and practice discussed in the literature for the sake of triangulation, it is not feasible to use such extended data gathering processes in most educational systems. In most instances an instrument is needed that can be administered to a large number of teachers in a limited, practical time frame, incorporating as many features of triangulation as possible.
The study adopted a qualitative–quantitative multimethod design using a questionnaire to profile teachers.
Research approach
The project was undertaken to design a professional development sequence for mathematics teachers to improve the effectiveness of their teaching of data handling and probability. The project comprised two parts: firstly, to profile Grade 8–12 mathematics teachers to determine their professional development needs in statistics education, and secondly, to use this information to develop a professional development course for Grade 8–12 mathematics teachers. This article describes the first part of this research project, namely the profiling of teachers to gather information about their knowledge, practice and beliefs in the field of statistics and statistics education in order to determine their professional development needs.
Research method
The profiling questionnaire was piloted with Grade 4–9 teachers after their completion of a series of three in-service training workshops of four and a half hours each on data handling and probability (Wessels, 2009). Apart from improving the internal validity of the questionnaire, piloting the profiling instrument was important for two reasons: firstly, to evaluate its use in the South African context, and secondly, to assess further professional developmental needs of the group of teachers it was administered to. Most of the teachers took more than two hours to complete the questionnaire; for the most part, their answers to the content-related questions were disconcerting. After completing the questionnaire, teachers in a group interview reflected on the questionnaire and expressed their need for further training in statistics. Teachers’ comments confirmed the observation that the questionnaire was too long. Two whole sections were subsequently eliminated from the questionnaire to shorten it.
The preliminary brainstorming activity about factors influencing the teaching of data handling and probability and factors that should be looked for in employing a teacher to teach data handling and probability were removed. The second section in the original questionnaire covered the preparation for teaching a unit in data handling and probability of the teacher’s choice. The questions were similar to questions in Section 3 on preparation for teaching the topics of sample and average, and this section was therefore omitted. The researchers were of the opinion that omitting the data that would have been generated by these two sections would not have a significant influence on the teacher profiles. Research participants
The sample consisted of 90 teachers from 23 diverse socio-economic schools in a large city in the north of the country, all with culturally diverse learner populations. Twenty government schools and three independent secondary schools were included. Only 90 out of 183 questionnaires that were distributed were returned: 39 questionnaires were received from schools with Afrikaans as language of instruction and 51 from schools with English as language of instruction. In only 24 questionnaires all sections were completed. The gender distribution of the returned questionnaires was 22 male participants and 56 female participants, with 12 questionnaires not indicating gender. Measuring instrument
The teacher profiling instrument developed by Watson (2001) has been adapted for use in several studies (Fitzallen, 2004; Watson, Beswick & Brown, 2006) and was also adapted for this study to profile Grade 8–12 mathematics teachers (Wessels & Nieuwoudt, 2010). The adapted instrument used in this study consisted of a questionnaire divided into eight sections. The questionnaire included closed and open-ended questions about teachers’ preparation, practices, content and pedagogical content knowledge about specific statistics topics and their application, teacher confidence and beliefs, as well as their training and professional development in statistics education. Questions in the eight sections can be cross-referenced to the different knowledge variables of mathematical knowledge for teaching, providing internal triangulation. The eight sections will be discussed under the Results section. An instrument making judgements about teacher knowledge must be nonthreatening and encourage authentic teacher reflection on beliefs, knowledge and practices to pass ethical requirements (I. Gal, personal communication, September 18, 2008; Watson, 2006). Shaughnessy (2007) describes Watson’s profiling instrument as nonthreatening because it obtains information about teachers’ content knowledge and pedagogical content knowledge of statistics by asking them to suggest appropriate as well as an inappropriate answers which they think learners would give to a number of statistical tasks. The profiling instrument had to be shortened and some items had to be adapted for use in the South African context, for example, the currency in Task 1 had to be changed from American dollar to South African rand. The questionnaire was designed to be used as either a survey or as a one hour to two hours semi-structured group or individual interview. Due to teachers’ busy schedules, group interviews were generally not feasible. Only one group of teachers at a specific school completed the questionnaire in a group interview; all the others responded individually. Statistical analysis
Analysis of the profiling questionnaire data was mainly qualitative but was supported by a limited quantitative analysis. An adapted Structure of Observed Learning Outcomes (SOLO) framework was used to categorise teachers’ understanding of specific statistics topics in Section 3 and of questions about the learner items in Section 6. The SOLO model (Biggs & Collis, 1982, 1991) categorises observed outcomes on four levels of progression. On the prestructural level the individual is not engaging in the task and is focusing on irrelevant aspects. On the unistructural level responses focus on the problem but use only one relevant element of the task. On the multistructural level, two or more elements are used, although no relationships between them are observed and processing of several disjoint aspects of the elements are usually done in sequence. Relational responses are characterised by the integration of multiple elements of the task. This adapted framework was used to categorise the developmental progression of increasing complexity that could be found in teacher descriptions (Watson, 2006). Reliability
Reliability of the questionnaire was improved after the pilot study by discussing questionnaire sections and questions with participants of the pilot study as well as with colleagues (peer examination). Coding reliability for statistical thinking levels was established through double coding by two independent researchers. More than 80% agreement on coding was reached without discussion. The remaining differences were discussed and consensus reached. A complicating factor of analysing observed outcomes in survey questions like those in Section 6 is that a teacher’s response might not have been the optimal response. An interview is needed to further probe a response in order to determine whether it was a functional or an optimal response (Watson, 2006). Validity
The validity of the findings of this study is dependent on the accuracy of the self-reported information. Although conflicting findings about accuracy are found in the literature, self-reported data are used in much of educational research because it is easier to collect, especially in larger studies (Fletcher & Barufaldi, 2002; Lambert, 2003). Internal validity of the questionnaire was improved through pilot study procedures such as administering the questionnaire exactly as it was planned to be administered in the main study; obtaining feedback from pilot study participants on questions; assessing the range of responses on each question; establishing whether replies can be interpreted according to the required information; revising questions and shortening the questionnaire (Van Teijlingen & Hundley, 2001). The challenge in external validity is to describe the results in such a way that other researchers can successfully ‘transfer’ the lessons learnt in this research to other studies (Bakker, 2004). Transferability of the instrument was already proven through adaptation and use in a number of other studies (Fitzallen, 2004; Watson, Beswick & Brown, 2006). Results generated from the use of a SOLO framework for determining levels of statistical thinking are similar to other studies conducted (Watson, 2006; Wessels, 2006). Ethical considerations
Information about the research and anonymity of participants was shared with the mathematics head of departments of all participating schools and accompanying letters with this information were distributed to all participants together with the questionnaires; participation was voluntary.
Results are reported by section and relative values (percentages) for all responses on questions are given, not only for the 24 fully completed questionnaires.
Section 1: Preparation for teaching a unit in data handling and probability
Less confident teachers spent more time on preparation than confident teachers and the teachers who spent little time on preparation, were less inclined to complete the questionnaire and to indicate confidence levels. During preparation of a unit on data handling, 78% of teachers consult someone, preferably a colleague, someone they meet at a course or with the Head of Department at their school. Forty-one per cent of teachers spend one hour to six hours to prepare the overview of a unit plan in data handling and probability, whilst 26% spend more than six hours.
Section 2: Teaching practices, including materials or resources used by teachers and learners
Two thirds (67%) of the respondents enjoy teaching data handling and probability. Teachers regard data representation (24%) and probability (16%) as the topics their learners enjoy most, whilst probability (24%), data representation (15%), and measures of dispersion (15%) are regarded as topics learners struggle with the most. Forty per cent of teachers prefer to address these difficulties in a traditional way by re-teaching the material, or by giving more explanations or activities, including remedial work or extra lessons. Strategies, such as using different approaches, changing teaching methods, using group work and discussion, and giving projects or examples from real life scenarios, are used by only 18% of the respondents. Using a calculator in teaching is common (96%), whilst 27% of teachers use computer software programs and 54% of the teachers who responded use concrete materials, including dice, coins and playing cards. Twenty-two per cent of the teachers do not use any data sources, whilst most of those that do, choose to use data from school textbooks and other books.
Section 3: The topics sample and average in data handling and probability
The adapted SOLO framework was used to determine levels of statistical thinking in teachers’ understanding of the two concepts sample and average (Watson, 2006). Almost 60% of teacher responses indicate higher levels of statistical understanding (multistructural and relational levels). This result is in striking contrast to teachers’ thinking levels when their understanding of the concept had to be transferred to a social context in a newspaper article (see ‘Handguns’ article in Section 6). Teachers’ confidence levels for teaching the topic of sampling are, however, on average 4.1 on a scale of 5 with 77% of them rating their own confidence levels a four or a five (see Section 4). These results are indicative of high confidence levels about theoretical knowledge despite an inability to apply this knowledge in context.
Teachers’ explanations of the meaning of average was also categorised using the adapted SOLO framework (Watson, 2006). Seventy seven per cent of responses were on the multistructural and relational levels of the SOLO framework, which is consistent with teachers’ high confidence levels on the teaching of the topic (see Section 4). Teachers seem to be more familiar with the topic of average than with sampling. It is therefore not surprising that teachers also expressed higher levels of confidence in the teaching of average than in the teaching of sampling (see Figure 1).
Section 4: Teacher confidence in the teaching of data handling and probability
Confidence levels of 1 and 2 on a scale of 5 were regarded as low confidence levels whilst levels of 4 and 5 were grouped together as high confidence levels (Figure 1). Responses indicating a confidence level of 3 on the scale of 5 as well as ‘No responses’ were not included in Figure 1. Areas where more teachers indicated somewhat lower levels of confidence are sampling and probability topics (Figure 1). A clear trend that emerged was that teachers who attend professional development workshops or courses feel more confident than those who do not: 81% of teachers indicating high confidence levels did participate in professional development. The very high levels of confidence in the teaching of data handling topics are not consistent with the levels of statistical thinking identified in teachers’ understanding of applications of the concepts in social contexts (also see Section 3 and 6).
Section 5: Beliefs about statistics in everyday life
Ten statements were made that ranged from beliefs in their own abilities to understand and interpret statistical terms and representations, risks, opinion polls, probability of winning a lottery, to the importance of statistics in everyday life. Examples of belief statements are ‘When buying a new car, it’s better to ask a few friends about the problems with their cars than to read a car satisfaction survey in a consumer magazine’ and ‘You need to know something about statistics to be an intelligent consumer’. South African teachers in general took an extreme position by strongly agreeing with almost all statements. The only issue where most teachers did not indicate strong agreement is the statement that weather reports are wrong so often that it cannot be taken seriously whilst a neutral viewpoint was expressed by 35% of the teachers Differences in gender and mother tongue of teachers did not play a significant role in their beliefs about statistics and the role of statistics in everyday life.
Section 6: Teacher comments on learner survey items to determine content knowledge and pedagogical content knowledge
Teachers were given five learner survey items and asked to give an example of both an appropriate and inappropriate response that learners could have given to each task. The first and third tasks included the application of sampling concepts; the second included graph interpretation, the fourth was about graphing and informal inferential reasoning whilst the last task comprised probability concepts. Responses to this section were disappointing. Many teachers did not respond to the questions at all; others only answered some of the questions. Virtually no feedback from teachers indicated appropriate as well as inappropriate responses to any of the learner items. Teacher responses were analysed with an adapted SOLO framework (Watson, 2006). Results of items number 2– number 5 will be given. Because both item number 1 and number 3 cover the application of sampling concepts in social contexts, only item number 3 will be discussed.In survey item number 2, learners were given a pie chart on grocery market shares and asked to explain what the chart was about and if they noticed anything unusual about it (see Figure 2). Teachers’ responses on the first question requiring an appreciation of the context of the message in the chart show different ranges of structural complexity. Prestructural responses resulted where teachers did not engage with the item, for example, ‘Who is it?’ and ‘Not relevant for teenagers’. Fourteen per cent of responses only referred to technical aspects (unistructural), for example, ‘Visually good ... students can see which is most/least’. However, many struggled with linking the percentage with its visual representation in the graph. Comments indicating greater appreciation of the context in varying degrees of detail (multistructural level) emerged in 38% of teacher responses with answers, such as ‘Is a visual picture of agents that sell groceries’ and ‘25.8% of the nationwide market is owned by Woolworths’. Remarks giving relative information about the different groups represented in the graph (relational), included statements, such as ‘It shows the relationship between the shares of different shops in the country’ and ‘It gives us information about the distribution of companies’ shares’ and represented 16% of the responses. For the second question, namely ‘Is there anything unusual about the graph?’, 12% of teachers gave answers that did not focus on the statistical nature of the message but on other details, for example, ‘Colour/dark or light may influence the response and order may influence perceptions’. Responses such as ‘They know ... Woolworths’ share prices have decreased in comparison with Spar’ focused on a statistical aspect in the message but missed the point. More than half of the teachers (57%) responded on a higher level, noticing that the visual appearance of the chart is inappropriate and that the percentages did not add up to 100%. Learner item number 3 cited a media report about a survey on handguns in schools and involved the interpretation of the concept of sampling: Handguns task: About six in 10 United States high school students say they could get a handgun if they wanted one, a third of them within the hour, a survey shows. The poll of 2 508 junior and senior high school students in Chicago also found 15 percent had actually carried a handgun within the past 30 days, with 4 percent taking one to school. Would you make any criticisms of the claims in this article? (Watson, 2001, p. 333) More than 50% of the teachers responded on an emotional level to the Handguns task (item number 3) giving statistically inappropriate answers (prestructural level) when asked to criticise the claims in the report (see Table 1). An example of a statistically inappropriate answer is ‘Weapons must be banned; schools will be extremely dangerous with this number of weapons available’. High crime levels in South Africa and the exposure of citizens to newspaper reports about violence in schools might have contributed to these emotional responses. Only 21% of responses were on a statistically appropriate level (relational level). An example of a statistically appropriate response is: ‘Chicago is only one area in the US and does not represent the whole US.’ Learner item number 4 indicates a newspaper report stating claims about the detrimental effect of family cars on health of citizens: Family car is killing us, says researcher: Twenty years of research has convinced Mr Robinson that motoring is a health hazard. Mr Robinson has graphs which show quite dramatically an almost perfect relationship between the increase in heart deaths and the increase in the use of motor vehicles. Similar relationships are shown to exist between lung cancer, leukemia, stroke and diabetes. (a) Draw and label a sketch of what one of Mr Robinson’s graphs might look like.
(b) What questions would you ask Mr Robinson about his research? (Watson, 2001, p. 334) Graphs presented for the first part of the task included bar, line and pie graphs. Sixty-one per cent of the teachers represented Mr Robinson’s ideas with appropriate graphs, showing a relationship between time and at least one other variable. More than half of the teachers asked statistically inappropriate questions about Mr Robinson’s claims (see Table 2). Examples of such responses on the prestructural and unistructural levels are: ‘What must be done to reduce that high risks? What material can be used to avoid the accidents on the road?’ and ‘What about HIV Aids?’ Statistically more appropriate answers include: ‘How did he conduct the research? What is the logical connection between the different illnesses and car use?’ and ‘Is the sample representative? Did he investigate other causes of the illnesses?’ In these multistructural and relational responses scepticism of the claims emerge and it is suggested that different variables could be connected with the described health hazards. The context of learner item number 5 entailed independent coin tosses. A media report about coin tosses at the start of international cricket matches stated that a certain captain had lost 8 out of 9 tosses in his previous 9 matches as captain. Issues included questions about the chance of one side of the coin coming up 4 out of 4 times, the chance of one side of the coin coming up after coming up 4 times in a row, et cetera. Only two teachers responded to the question ‘Suppose Border decides to choose heads from now on. For the next 4 tosses of the coin, what is the chance of the coin coming up tails (and him losing the tosses) 4 times out of 4?’ Neither one of these responses considered the multiplicative nature of independent events and therefore gave incorrect answers. Answers to other questions in this item were equally few and disappointing; some teachers wrote ‘I don’t know’ or made a question mark as answer to some of the questions. The fact that only one of the 90 teachers responded to all the questions on learner item number 5 and that so few responded correctly or at all suggests a lack of knowledge and experience with probability concepts and is also consistent with the lower confidence levels indicated for the teaching of probability topics.
 |
FIGURE 2: Survey item number 2 ñ nationwide retail grocery market shares.
|
|
|
TABLE 1: Teachersí statistical thinking levels for item number 3 (Handguns task).
|
|
TABLE 2: Teachers statistical thinking levels for item number 4 (Family car task).
|
Sections 7 and 8: Teacher background and professional development
Gender distribution of respondents is 61% female, 24% male with 15% not indicating gender. Teaching experience of participants range from a few months to 30 years with 55% teaching less than 14 years and 25% of teachers falling in the 5−9 years experience interval (Figure 3). Forty-eight per cent of Grade 10–12 teachers had statistics training of 6 months or more during their initial teacher education, whilst only 33% of Grade 8 and Grade 9 teachers received such training. No trend regarding teaching experience and completion of the questionnaire could be found. As in the case of teaching experience, professional development experiences of teachers ranged widely from no professional development experience to a postgraduate diploma in statistics education. Fifty-seven per cent of respondents did not participate in any professional development experiences. Of those who participated in professional development, 52% participated in organised initiatives with colleagues whilst 38% did so on own initiative, mostly enrolling for a distant tuition course at a university. Forty-nine per cent of the teachers indicated that they prefer the professional development training to be presented by an outside expert as opposed to a colleague (17%) or regional curriculum facilitator (14%). Feedback to open-ended questions about professional development included: ‘Development (professional) should be an ongoing process’; ‘Teacher mentorship programmes are needed’; and ’Professional development must be practical and practice orientated’. These teacher comments concur with Garet et al.’s (2001) claim that ‘Professional development is likely to be of higher quality if it is both sustained over time and involves a substantial number of hours’ (p. 933). One comment refers to teachers’ own responsibility to add to their knowledge: ‘Reading up is essential’. A number of teachers emphasise that professional development courses should be presented by specialists – specifically specialists with classroom experience in teaching statistics.
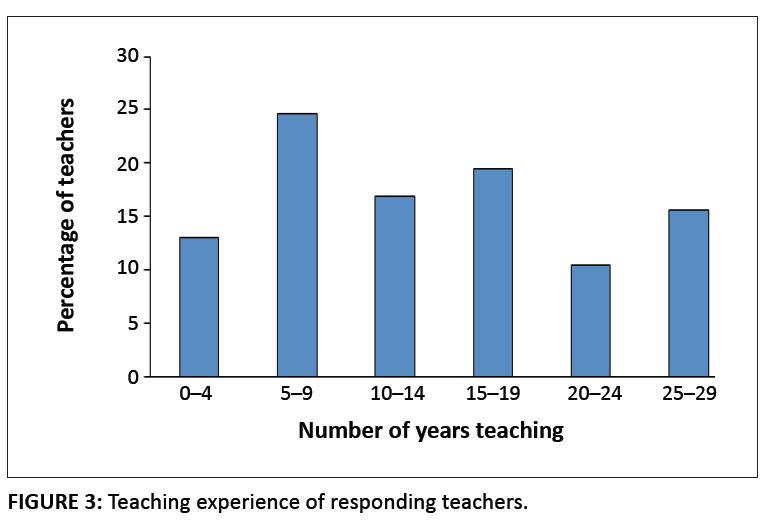 |
FIGURE 3: Teaching experience of responding teachers.
|
|
Reasons for including statistics in school curricula have been repeatedly emphasised over the past years (Franklin et al., 2005; Shaughnessy, 2007; Wild & Pfannkuch, 1999), specifically the usefulness of statistics and probability for daily life, its instrumental role in other disciplines, the need for a basic knowledge of statistics and probability in many professions, and the important role of statistics in developing critical reasoning. In the South African mathematics curriculum, the learning outcome ‘data handling’ (statistics) is part of the mathematics curriculum and states that learners should be able ‘to collect, summarise, display and critically analyse data in order to draw conclusions and make predictions, and to interpret and determine chance variation’. The kinds of skills learners need to develop in statistics are not explicitly stated in the curriculum document, but are evident in the verbal terms of ‘drawing conclusions and predicting’ (Department of
Education, 2002, p. 88). These terms indicate inference skills, which is the essence of statistics (Cobb, 2007; I. Gal, personal communication, September 18, 2008; Moore, 1990; Paparistodemou & Meletiou-Mavrotheris, 2008). Teachers need to move beyond the point where they are teaching only basic statistical knowledge, for example, graphs, mean, median, and mode, into the area of informal inference, teaching learners to ‘look beyond the data’ (Franklin et al., 2005; Makar & Rubin, 2009). To be able to do this, teachers need to integrate and reason with multiple constructs (such as sampling, distribution, measures of shape,
centre, and spread) when comparing different samples of data, estimating and drawing graphs of populations based on samples, and reasoning about the likelihood of competing statements being true (Pfannkuch, 2006; Zieffler, Garfield, delMas & Reading, 2008). Teachers have to understand and feel comfortable with these constructs at least at an intuitive level to be able to use them as part of their reasoning and to develop learners’ statistical reasoning skills. Results of this study clearly show that mathematics teachers in many cases lack specialised content knowledge of statistics or do not understand different constructs in statistics sufficiently to apply their knowledge and reason with these constructs in social contexts, such as newspaper articles and research reports.Positive changes in teacher knowledge, classroom practice, beliefs and attitudes, and consequent changes in student learning outcomes would require ongoing professional development to empower teachers through contact sessions, classroom and online support, encouragement of reflection and engagement in professional communities of practice (Burgess, 2010; Shaughnessy, 2007; Wassong & Biehler, 2010). The length of the questionnaire contributed to the fact that so few of the teachers completed all sections. Several teachers felt that it took too long and that they had to put in too much effort to answer some of the questions (e.g. learner items in Section 6). One school returned all questionnaires without completing any questions. The mathematics head teacher explained that they did not have the confidence to complete it because of their lack of knowledge about data handling and probability. This comment is in line with comments of other teachers that they did not have enough content knowledge to answer the questions. Seventy-three per cent of the teachers did not complete Section 6, but 80% of teachers not completing this section did complete Section 7 and/or Section 8, suggesting that teachers found the questions either too difficult to interpret or answer, or too time consuming and skipped it altogether. With the exception of one school where teachers completed the questionnaire in a group, teachers completed the questionnaire in their own time and may not have felt obliged to complete all sections as may have happened when completing it in a group interview. Analysis of the data was limited by the fact that many teachers did not complete the last few sections which included questions on teacher background, such as experience, initial teacher training and participation in professional development initiatives. The fact that only 24 teachers completed all sections of the questionnaire limited quantitative analysis of the profiling instrument.
It is, however, useful to consider some trends in the responses of this group of 24 teachers. Twenty-one teachers in this group
indicated that they enjoy teaching data handling and probability; two said that they sometimes enjoy it whilst another one said
that she enjoys it but sometimes finds it boring to teach. Only 3 of the 24 teachers who completed all sections did not undergo
statistics training during their teacher education, with 7 teachers having spent a semester studying statistics and 10
of them having undergone training in statistics for a year or more. The implication is that these teachers felt confident
enough to complete all questions and might be more positive about teaching statistics, therefore putting more effort into the
completion of the questionnaire. Teaching experience (i.e. 2–29 years), and gender (10 male and 12 female respondents)
did not play any significant role in this group. As reported in other studies, teacher responses on the different learner items show the need for rich class discussions and the
necessity to link statistical concepts to social contexts and media examples (Shaugnessy, 2007; Watson, 2006; Zawojewski & Shaugnessy,
2000). The lack and inaccuracy of responses to the questions about probability in Section 6 is disconcerting especially when taking into
account the lack of emphasis in the mathematics curriculum on the topic of probability. Probability is examined in an optional
third paper in the Senior Certificate external Grade 12 assessment (Department of Education, 2008, p. 12). Anecdotal evidence suggests
that probability is not taught in many schools during school hours and that some Grade 8 and Grade 9 teachers therefore regard probability,
although part of the curriculum in these grades, as not important and do not teach it, pleading a full curriculum and not having
enough time to cover all aspects. It is, however, crucial to introduce chance and probability concepts to students even much earlier
than Grade 8 and Grade 9 (Watson, 2006). It is imperative that professional development of teachers should include probability
activities.
|
Conclusions and recommendations
|
|
The profiling instrument in this study provides a broad but incomplete picture of mathematics teachers’ statistical knowledge, practices and beliefs, supplying information about the professional development needs of the teachers profiled. This profiling instrument can be useful for institutions researching professional development needs of large populations of teachers, but can be equally useful to profile individual teachers or smaller groups of teachers. Because the reasons for specific answers or the lack of answers to questions are not always clear from the responses in the questionnaire, semi-structured ethnographic teacher interviews, portfolios and classroom observations can be used to provide richer data and to add to the picture compiled by the profiling instrument. More focused studies with larger numbers of teachers are needed to enable a more thorough quantitative analysis to tease out relationships between and significance of different topics in the questionnaire. Developers of in-service teacher education programmes in statistics, whether part of mathematics education or on its own, should take cognisance of the usefulness of a profiling instrument supplemented by data from interviews, portfolios and classroom observations for informing the design of such programmes. Measuring and interpreting teacher knowledge and beliefs is not a clear-cut venture. Explicit criteria to guide measure development are needed (Hill, Ball & Schilling, 2008). The fact that teacher knowledge, beliefs and attitudes are interwoven implies that programmes developed for professional development must ‘ensure that all categories are targeted in a cohesive and connected way, in order to ensure that teacher knowledge develops effectively’ (Burgess, 2010, p. 5).
The financial assistance of the National Research Foundation (NRF #SFP2007012300001) and the North-West University is hereby acknowledged. Any opinions, findings and conclusions or recommendations are those of the authors and do not necessarily reflect the views of the supporting organisations.
Competing interests
The authors declare that they have no financial or personal relationship(s) which may have inappropriately influenced them in writing this article.
Authors’ contribution
H.W. conducted all the research and wrote the manuscript, whilst H.N. was project leader and made conceptual contributions.
Ambrose, R. (2004). Initiating change in prospective elementary school teachers’ orientations to mathematics teaching by building on beliefs. Journal of Mathematics Teacher Education,
7(2), 91−117. doi:10.1023/B:JMTE.0000021879.74957.63Bakker, A. (2004). Design research in statistics education: On symbolizing and computer tools. Doctoral dissertation. Utrecht: CD-β Press. Ball, D.L., Thames, M.H., & Phelps, G. (2008). Content knowledge for teaching: What makes it special? Journal of Teacher Education, 59(5), 389−407.
doi:10.1177/0022487108324554 Biggs, J.B., & Collis, K.F. (1982). Evaluating the quality of learning. The SOLO taxonomy. New York, NY: Academic Press. Biggs, J.B., & Collis, K.F. (1991). Multimodal learning and the quality of intelligent behavior. In H.A.H Rowe (Ed.), Intelligence: Reconceptualization and measurement (pp. 57–76). New Jersey: Lawrence Erlbaum Associates. Borko, H. (2004). Professional development and teacher learning: Mapping the terrain. Educational Researcher, 33 (8), 3−15. doi:10.3102/0013189X033008003 Burgess, T.A. (2010). Using classroom video to identify development of teacher knowledge. In C. Reading (Ed.), Proceedings of the 8th International Conference on Teaching Statistics [CD]. Voorburg, The Netherlands: International Statistics Institute. Cobb, G.W. (2007). The introductory statistics course: A Ptolemaic curriculum? Technology and Innovations in Statistics Education, 1(1). Retrieved April 08, 2008, from http://escholarship.org/uc/item/6hb3k0nz Corcoran, T.B. (1995). Helping teachers teach well: Transforming professional development. Policy Briefs. Rutgers, University of New Jersey, University of Wisconsin-Madison, Harvard University, Stanford University, University of Michigan: Consortium for Policy Research in Education (CPRE). Department of Education. (2002). Revised national curriculum statement Grades R-9 (Schools), Mathematics. Pretoria: Department of Education. Department of Education. (2008). National curriculum statement Grades 10–12, Mathematics: Subject assessment guidelines. Pretoria: Department of Education. Fitzallen, N.E. (2004). Profiling teachers’ integration of ICT into professional practice. In Proceedings of the Australian Association for Research in Education International Educational Research Conference, 29 November – 02 December 2004 (n.p.). Melbourne, Australia: Australian Association for Research in Education. Retrieved May 15, 2005, from
http://www.aare.edu.au/04pap/fit04868.pdf Fletcher, C.L., & Barufaldi, J.P. (2002, April). Evaluating professional development with student data: Challenges and successes for project ESTT. Paper presented at the Annual Meeting of the National Association of Research in Science Teaching, New Orleans, LA. Franklin, C., Kader, G., Mewborn, D., Moreno, J., Peck, R., Perry, M., & Schaeffer, R. (2005). Guidelines for assessment and instruction in Statistics Education (GAISE) Report. A Pre-K–12 Curriculum Framework. Alexandria, VA: American Statistical Association. Retrieved July 14, 2007, from www.amstat.org/education/gaise Garet, M., Porter, A., Desimone, L., Birman, B., & Yoon, K. (2001). What makes professional development effective? Results from a national sample of teachers. American Educational
Research Journal, 38 (3), 915−945. doi:10.3102/00028312038004915 Graven, M. (2004). Investigating mathematics teacher learning within an in-service community of practice: the centrality of confidence. Educational Studies in Mathematics, 57(2),
177–211. doi:10.1023/B:EDUC.0000049277.40453.4b Hill, H.C., Ball, D.L., & Schilling, S.G. (2008). Unpacking pedagogical content knowledge: Conceptualizing and measuring teachers’ topic-specific knowledge of students. Journal for Research in Mathematics Education, 39(4), 372−400. Hill, H.C., Sleep, L., Lewis, J.M., & Ball, D.L. (2007). Assessing teachers’ mathematical knowledge. In Lester, F.K. (Ed.), Second Handbook of Research on Mathematics Teaching and Learning (pp. 111−155). Charlotte, NC: National Council of Teachers of Mathematics. Ingvarson, L., Beavis, A., Bishop, A., Peck, R., & Elsworth, G. (2004). Investigation of effective mathematics teaching and learning in Australian secondary schools. Canberra: Australian Council for Educational Research (ACER), Commonwealth of Australia. Ingvarson, L., Meiers, M., & Beavis, A. (2005). Factors affecting the impact of professional development programs on teachers’ knowledge, practice, student outcomes and efficacy. Education Policy Analysis Archives, 13(10). Lambert, R.G. (2003). Considering purpose and intended use when making evaluations of assessments: A response to Dickinson. Educational Researcher, 32(4), 23−26.
doi:10.3102/0013189X032004023 Makar, K., & Rubin, A. (2009). A framework for thinking about informal statistical inference. Statistics Education Research Journal, 8(1), 82−105. Retrieved June 16, 2010, from
http://www.stat.auckland.ac.nz/~iase/serj/SERJ8(1)_Makar_Rubin.pdf Moore, D. (1990). Uncertainty. In L. Steen (Ed.), On the shoulders of giants: New approaches to numeracy (pp. 95−137). Washington, DC: National Academy Press. North, D., & Zewotir, T. (2006). Introducing Statistics at school level in South Africa. In A. Rossman & B. Chance (Eds.), Proceedings of the 7th International Conference on Teaching Statistics [CD]. Voorburg, The Netherlands: International Statistics Institute. North, D., & Scheiber, J. (2008). Introducing statistics at school level in South Africa: The crucial role played by the national Statistics Office in training in-service teachers. In C. Batanero, G. Burrill, C. Reading, & A. Rossman (Eds.), Proceedings of the 18th ICMI Study Conference and 2008 IASE Round Table Conference, 30 June – 04 July 2008. Voorburg, The Netherlands: International Statistical Institute and International Commission on Mathematical Instruction. Retrieved from
http://www.ugr.es/~icmi/iase_study/Files/Topic6/T6P2_North.pdf Paparistodemou, E., & Meletiou-Mavrotheris, M. (2008). Developing young students’ informal inference skills in data analysis. Statistics Education Research Journal, 7(2), 83−106, Retrieved March 08, 2009, from
http://www.stat.auckland.ac.nz/~iase/serj/SERJ7(2)_Paparistodemou.pdf Pfannkuch, M. (2006). Informal inferential reasoning. In A. Rossman & B. Chance (Eds.), Proceedings of the 7th International Conference on Teaching Statistics [CD]. Voorburg, The Netherlands: International Statistics Institute. Philipp, R.A. (2007). Mathematics teachers’ beliefs and affect. In F.K. Lester (Ed.), Second handbook of research on mathematics teaching and learning (pp. 257−315). Charlotte, NC: National Council of Teachers of Mathematics. Remillard, J.T., & Bryans, M.B. (2004). Teacher orientations toward mathematics curriculum materials: Implications for teacher education. Journal for Research in Mathematics Education,
35, 352−388. doi:10.2307/30034820 Shaughnessy, J.M. (2007). Research on statistics learning and reasoning. In F.K. Lester (Ed.), Second handbook of research on mathematics teaching and learning (pp. 957−1009). Charlotte, NC: National Council of Teachers of Mathematics. Schulman, L.S. (1987). Knowledge and teaching: Foundations of the new reform. Harvard Educational Review, 57, 1−22. Sowder, J.T. (2007). The mathematical education and development of teachers. In F.K. Lester (Ed.), Second handbook of research on mathematics teaching and learning (pp. 157−223). Charlotte, NC: National Council of Teachers of Mathematics. Staub, F.C., & Stern, E. (2002). The nature of teachers’ pedagogical content beliefs matters for students’ achievement gains: Quasi-experimental evidence from elementary mathematics. Journal of Educational Psychology, 94, 344−355.
doi:10.1037/0022-0663.94.2.344 Van Teijlingen, E.R., & Hundley, V. (2001). The importance of pilot studies. In Social Research Update, Issue 35 (n.p.). Surrey, UK: Department of Sociology, University of Surrey. (ISSN: 1360-7898). Wassong, T., & Biehler, R. (2010). A model for teacher knowledge as a basis for online courses for professional development of statistics teachers. In C. Reading (Ed.), Proceedings of the 8th International Conference on Teaching Statistics [CD]. Voorburg, The Netherlands: International Statistical Institute. Watson, J.M. (2001). Profiling teachers’ competence and confidence to teach particular mathematics topics: The case of data and chance. Journal of Mathematics Teacher Education, 4, 305−337.
doi:10.1023/A:1013383110860 Watson, J. (2006). Statistical literacy at school: Growth and goals. Mahwah, NJ: Lawrence Erlbaum Associates. Watson, J., Beswick, K., & Brown, N. (2006). Teachers’ knowledge of their students as learners and how to intervene. In P. Grootenboer, R. Zevenbergen, & M. Chinnappan (Eds.), Proceedings of the 29th Annual Conference of the Mathematics Education Research Group of Australasia, 01–05 July 2006 (pp. 551−558). Adelaide, Australia: Mathematics Education Research Group of Australasia. Wessels, H.M. (2006). Types and levels of data arrangement and representation in statistics as modeled by grade 4 to 7 learners. Unpublished doctoral dissertation. University of South Africa, Pretoria, South Africa. Available from http://hdl.handle.net/10500/1867 Wessels, H.M. (2008). Statistics in the South African school curriculum: Content, assessment and teacher training. In C. Batanero, G. Burrill, C. Reading, & A. Rossman (Eds.), Proceedings of the 18th ICMI Study Conference and 2008 IASE Round Table Conference, 30 June – 04 July 2008 (n.p.). Voorburg, The Netherlands: International Statistical Institute and International Commission on Mathematical Instruction. Retrieved February 09, 2009, from
http://www.ugr.es/~icmi/iase_study/Files/Topic1/T1P3_Wessels.pdf Wessels, H.M. (2009). Effective teaching and learning of Grade 8 and 9 statistics. Unpublished post doctoral research report, North-West University, Potchefstroom, South Africa. Wessels, H.M., & Nieuwoudt, H.D. (2010). Teacher knowledge and confidence in Grade 8 and 9 data handling and probability. In C. Reading (Ed.), Proceedings of the 8th International Conference on Teaching Statistics [CD]. Voorburg, The Netherlands: International Statistical Institute. Wild, C., & Pfannkuch, M. (1999). Statistical thinking in empirical enquiry. International Statistical Review, 67(3), 223−265.
doi:10.2307/1403699, doi:10.1111/j.1751-5823.1999.tb00442.x,
doi:10.2307/1403705 Zieffler, A., Garfield, J., DelMas, R., & Reading, C. (2008). A framework to support research on informal inferential reasoning. Statistics Education Research Journal, 7(2), 40−58. |
