|
Article Information
|
Authors:
Cyril Julie1
Lorna Holtman1
Monde Mbekwa1
Affiliations:
1School of Science and Mathematics Education, University of the Western Cape, South Africa
Correspondence to:
Cyril Julie
Email:
cjulie@uwc.ac.za
Postal address:
Private Bag X17, Bellville 7535, South Africa
Dates:
Received: 23 June 2011
Accepted: 09 July 2011
Published: 14 Sept. 2011
How to cite this article:
Julie, C., Holtman, L., & Mbekwa, M. (2011). Rasch modelling of Mathematics and Science teachers’ preferences of real-life situations to be
used in Mathematical Literacy. Pythagoras, 32(1), Art. #13, 8 pages.
http://dx.doi.
org/10.4102/pythagoras.
v32i1.13
Copyright Notice:
© 2011. The Authors. Licensee: AOSIS OpenJournals. This work is licensed under the Creative Commons Attribution License.
ISSN: 1012-2346 (print)
ISSN: 2223-7895 (online)
|
|
|
|
Rasch modelling of Mathematics and Science teachers’ preferences of real-life situations to be used in Mathematical Literacy
|
|
In This Original Research...
|
Open Access
|
• Abstract
• Introduction
• Background
• Research question
• Measurement with rating scales
• Research method
• Instrumentation, sample and procedure
• Ethical considerations
• Results
• Variance and unidimensionality
• Differential item functioning
• Rank ordering of the items
• Discussion and conclusion
• Acknowledgements
• Competing interests
• Authors’ contributions
• References
• Footnote
|
|
In order to ascertain the real-life situations that teachers, as stakeholders, would find suitable and appropriate to deal with in Mathematical Literacy
(a compulsory subject for students who are not doing Mathematics at the Further Education and Training level of the South African education system), we
embarked on a study known as the Relevance of School Mathematics Education (ROSME). The principle underpinning this article is that there are times when it
is necessary to assess the functionality and quality of questionnaires used to ascertain affective domain issues. The study provides an analysis technique
which is not affected by the sample of individuals completing a questionnaire, provided that the instrument meets particular requirements. It thus improves
the rigour of measurement. Various statistics obtained in this study showed that the instrument used to determine the real-life situations which teachers
prefer for Mathematical Literacy reasonably identifies this variable. However, it is cautioned that much more care needs to be exercised in construction of
such instruments. The results also indicated the real-life situations which teachers most and least preferred to be included in Mathematical Literacy, providing
useful information for policy-makers and textbook authors on contextual situations to be included in learning materials.
It is widely recognised that affective domain issues such as beliefs, attitudes, interest, motivation and perceptions are important determinants for effective
teaching and learning. Although other means, such as interviews and observations, are used to ascertain affective domain issues in educational research, the
dominant research approach is the use of surveys with Likert scale-type questionnaires. This approach is followed due to the advantages offered by survey
research. Despite criticisms offered against questionnaires, Pring (2005, p. 39) argues for the value of survey research, particularly as it pertains to the
interpretation of questionnaire items, stating that ‘The meanings which the respondents attribute to the questions are not something private and subjective,
but the meanings which anyone conversant with the language would attribute to them’.
In terms of affective domain issues, the survey instruments used are normally concerned with a latent trait or variable which is operationalised through the
questionnaire items. Thus effectively a questionnaire comprises a set of items which are realisations of the latent trait being investigated, and respondents
are requested to rate each item on the scale. This implies that questionnaires dealing with affective domain issues are effectively rating scales.
This is, for example, the case with the questionnaire used by Swanepoel and Booyse (2006, p. 190) to ascertain the ‘views of South African secondary-school
principals regarding the involvement of their teachers in processes of school change’. Similarly, the rating scale underpinning of a questionnaire comes to
the fore in the study conducted by Lessing and De Witt (2007, p. 57) on ‘the perceptions of teachers on the value’ of a workshop presented
to them. This also is the case in Vermeulen’s (2007) study on the mathematical anxiety of Grade 10 learners, for which an adapted ‘attitudes toward
mathematics’ inventory was used.
In much research, as in the case of the aforementioned three studies, the salient aspects of the operation of such scales and their quality are not discussed
and reported. This is understandable at least in terms of the space limitations of research articles. What is normally reported, however, is the derivation of
the questionnaire from theoretical bases and practical observations, reliability coefficients and various measures undertaken to ensure construct validity.
In the study reported here, the view is that there is at all times a need to assess the operation and quality of questionnaires used to ascertain affective
domain issues. One of the major reasons for this is that in order to make meaningful, confident and believable recommendations for policies and practices in
education, a crucial requirement is that the measurement instrument employed be beyond suspicion with regard to its functioning or, as expressed in legal parlance,
‘it should be beyond reasonable doubt’. This is especially important given the current scepticism of the value of educational research rendering low
returns by not providing convincing guidance on issues of importance to governments, policy-makers and those involved in professional practices in education
(Pring, 2005).
This article reports in-depth on the functioning of a survey instrument designed to ascertain the hierarchical order that Science and Mathematics teachers assign
to real-life situations to be used in school mathematics.
Background
It is well known that Mathematical Literacy was introduced as a compulsory subject for those learners not enrolled for Mathematics in the Further Education
and Training Phase (Grades 10−12). This curriculum focuses heavily on the use of mathematics in real-life situations or contexts. A burning question regarding
these contexts is who decides on the contexts to be used in Mathematical Literacy? It is obvious that there are a number of important stakeholders in education that
should decide on the real-life situations that should be used in Mathematical Literacy.
The voices of teachers, however, have been silent in this regard, despite the fact that they can provide valuable insights about desirable real-life situations
which could possibly be used in mathematics. A study by Zevenbergen, Sullivan and Mousley (2002) brought this to the
fore in their report on a group of indigenous Australian teachers who did not find the context of a police identification parade suitable and appropriate as
inspiration for an open-ended mathematical activity that dealt with averages.
Using learning resources with which teachers subjectively identify has the potential to improve their engagement with the subject matter and intended objectives
of the curriculum for Mathematical Literacy. As Julie asserts:
What engages teachers and what [does] not is a complex issue. Immediacy in terms of what I can use in my situation as it is currently is emerging as a facet
of teacher behaviour regarding relevance. (Julie, 2002, p. 7)
Notwithstanding the isolated Australian example, the issue of contexts that teachers would find desirable to be dealt with in Mathematical Literacy is an
under-researched area in the research literature. Knowledge about such contexts could benefit experts in developing learning resources for Mathematical
Literacy. In order to ascertain contexts that teachers, as stakeholders, would find suitable and appropriate to deal with in Mathematical Literacy, we embarked
on a study known as the Relevance of School Mathematics Education (ROSME). In this article we discuss the functioning of the instrument used to ascertain the
teachers’ preferred contexts to be used in Mathematical Literacy.
The interrelated research questions flowing from the aforementioned narrative and pursued in this research were the following:
1. How well does an instrument used to ascertain the real-life situations preferred for teaching Mathematical Literacy function?
2. How are the items arranged hierarchically in terms of level of agreement?
From the measurement and survey construction literature (e.g. Deselle, 2005; Fowler, 1995), the functioning of an instrument is defined as whether (1)
the instrument represents a single trait or construct; (2) the items form a hierarchy; (3) there are persons and items that do not contribute towards the
construct being operationalised; and (4) the items comprising the questionnaire are unique (there are no redundant items).
Measurement with rating scales
As is clear from the introduction, rating scales measure latent traits or constructs. The constructs being measured are not directly observable. For example,
when teachers have attended a course or workshop, the appropriateness of such an experience for their practice cannot be ascertained through observation. The
construct of importance in this case is ‘the appropriateness of course X for teachers’ practice’. In order to ascertain this
‘appropriateness’, some instrument is developed to operationalise the abstract construct.
Such an instrument consists of a set of items and the respondents are requested to express their level of agreement with each item on some hierarchically
ordered response scale. The response scale contains more than one category, which allows for the making of judgements on the level of endorsement that each
respondent and the entire cohort give to the item or the scale.
For a scale to represent the construct being measured, it should fulfil certain requirements. Wright and Master (1982, p. 3) list these requirements as:
1. the reduction of experience to a one dimensional abstraction
2. more or less comparisons amongst persons and items
3. the idea of linear magnitude inherent in positioning objects along a line
4. a unit determined by a process which can be repeated without modification over the range of the variable.
The first requirement implies that there must be some certainty that the scale does not measure more than one construct. This assurance starts with the
researchers carefully selecting items for the scale, based on the range of literature deemed to provide information on the construct of interest, their own
experience and knowledge and those of other experts informing the domain of interest of the construct. Decisions concerning the defining items occur through
a process of constructive and competitive argumentation.
The second requirement necessitates that the scale should be able to distinguish between respondents who have various levels of endorsement for the construct.
A further demand relating to the scale is that the items should form some sort of hierarchy. This is also initially decided upon at a theoretical level by the
scale constructors.
The linearity requirement is to ensure that the words such as ‘highly disagree’, ‘disagree’, etcetera which are being used as response
categories comply with the equality of distances when translated into numbers.
About the fourth requirement, Wright and Masters (1982, p. 3) assert that what is required is ‘a theory or model for how persons and items must interact to
produce useful measures’.
In essence, these requirements are the conditions which social scientists place on a measurement scale as a response to the conundrum of whether what is in other
people’s heads can be measured or not.
In addition to the aforementioned conceptual approach in developing useful measurement scales, recently there has also emerged the bolstering of such development
with quantitative assessment of the derived instruments. Rasch methods are one such set of procedures used to evaluate whether an instrument is indeed useful for
measuring a latent trait. According to Linacre (2008, p. 12): ‘Rasch analysis is a method for obtaining fundamental linear measures (qualified by standards
errors and quality-control fit statistics) from stochastic observation of ordered category responses’. The Rasch model is a probabilistic model and explains
how a person’s level of endorsement of an item on a scale dealing with a latent trait is predicted by the person’s endorsement of the scale. For polytomous
rating scale data, such as under discussion in this article, the model is:
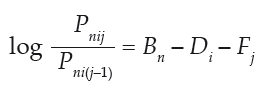
where
Pnij is the probability that person n encountering item i is observed in category j,
Bn is the “ability” measure of person n,
Di is the “difficulty” measure of item i, the point where the highest and lowest categories of the item are
equally probable.
Fj is the “calibration” measure of category j relative to category j-1, the point where categories j-1 and
j are equally probable relative to the measure of the item. (Linacre, 2008, p. 99)
This model is taken as the ideal which the data must fulfil for the rating scale to be viable. However, collected data invariably deviate from this ideal. With
Rasch analysis the quest is to determine how closely the data fit the model; thus a model is not developed to fit the obtained data. As stated by De Roos and
Allen-Meares, the Rasch model is:
… a normative model for constructing interval-level unidimensionality of data on a group of subjects for a set of items they have completed. The of items on
a line that indicates greater and lesser amounts of the variable being measured constitutes operationalization of the variable. The Rasch model defines the ideal
delineation of items that would constitute an objective, interval-level measuring instrument. (De Roos & Allen-Meares, 1998, pp. 95−96)
The Rasch procedures report their outcomes in logits derived from the conversion of a raw score according to the aforementioned mathematical formula. In addition
to application of Rasch modelling in a variety of academic domains, substantial work has also been done on Rasch modelling itself, as indicated by Andrich (1988)
and Bond and Fox (2001).
Given this description of the Rasch model, data obtained through implementation of a conceptually developed scale can be tested to provide an indication of whether
it satisfies the four requirements of a useful scale listed earlier.
Rasch analysis has been used to analyse the robustness of instruments in a variety of settings. It has also been used in various educational projects, such as the
large-scale assessment project Trends in Mathematics and Science Study (TIMSS), teacher professional development studies, learner performance on school tests, as
well as in medical education and other health-related studies.
Boone and Scantlebury (2006, p. 267) used Rasch analysis to interrogate the functioning of an achievement test in Science, finding items that ‘functioned
differently for African American students compared with their White peers’. They further recommend the use of the Rasch model, since by ‘using the
Rasch model, science educators can improve the quality of quantitative measurement at the individual and the systemic level’ (p. 267). Mpofu et al. (2006, p. 329)
used Rasch modelling to investigate health risk behaviour of a South African cohort of teenagers, reporting that ‘The results from the analysis …
suggest that an underlying or latent variable defines health risk in South African teenagers’.
These studies indicate that Rasch modelling is used to assess and improve the functioning of measurement instruments for researchers to use, to make more informed
decisions about issues of import and thereby improve the measures of intervention. In 2006 the Mathematics Education Research Journal devoted an
entire edition (vol. 18, No. 2) to the use of Rasch procedures in research in Mathematics Education. Regarding the issue under purview in this article,
Callingham and Bond (2006, p. 1) argue that ‘The Rasch rating scale model allows Likert scale attitude data to be thought about in developmental rather than
merely descriptive ways’.
Rasch analysis of the data obtained for this study was performed using the Winstep suite of computer programs (Linacre, 2008).
Instrumentation, sample and procedure
The instrument under discussion is a 20-item questionnaire developed by a group of mathematics educators and postgraduate students in Mathematics Education
(Julie & Mbekwa, 2005). The major criterion used to identify items was that issues inherent in the cluster should be amenable to mathematical treatment.
Two of the items were strictly intra-mathematical items (‘Mathematics that will help learners to do mathematics at universities and technikons’
and ‘To do their mathematics with calculators and computers’), and one dealt with mathematical practice (‘The kind of work mathematicians
do’). In order to focus the instrument on real-life situations these items were removed, so the instrument under scrutiny in this article therefore
consisted of 17 items. For each of these items teachers had to indicate their preference, by selecting a response 1, 2, 3 or 4 with ‘1’ indicating
‘strongly disagree’ and ‘4’ indicating ‘strongly agree’.
Data were collected by the researchers and their colleagues from teachers attending university in-service programmes and by postgraduate students in their own
and neighbouring schools. The postgraduate students taught in urban and peri-urban areas throughout the Western Cape Province of South Africa. Given that
teachers who attended this specific university teach primarily in low socio-economic areas, and the questionnaire specifically requested that they should indicate
the real-life situations they would prefer learners in Grades 10–12 to engage with in Mathematical Literacy, it can be assumed that their responses were
targeted at learners from these environments.
The sample was thus a convenience sample. Science teachers were included in the sample, based on the plausible assumption that such teachers have an interest
in the real-life situations that are dealt with in Mathematical Literacy. It is also a common occurrence that Science teachers are assigned to teach Mathematical
Literacy based on workload considerations in schools.
In order to ascertain the usefulness of the sample, an assessment was done on whether there were misfitting persons; these are ‘persons who have not used
these items in the way it was intended’ (Wright & Masters, 1982, p. vi) and their responses are deemed as being idiosyncratic. This might, for example,
happen when respondents give the same response for all the items or respond to the first few items and leave the rest blank, and so forth. For the instrument under
discussion, 67 questionnaires were returned. Rasch analysis was done for misfitting persons, and 18 misfitting persons were found through an iterative process of
analysis and removal of such persons. Further analyses were done with the remaining 49 respondents.
The demographic information relating to the 49 teachers of Mathematics, Science and Biology is presented in Table 1. Respondents were not asked whether or
not they were Mathematics or Mathematical Literacy teachers or both.
One can glean from Table 1 that the majority of teachers were teaching in the Further Education and Training phase (Grades 10–12) and had at least 10
years of teaching experience.
Ethical considerations
At the time of data collection respondents were assured of confidentiality and anonymity, and that their participation was voluntary and they could withdraw at
any time. They were further informed that there would be no penalties related to their results for assessment of courses they were following.
Variance and unidimensionality
A procedure to determine the unidimensionality of an instrument measuring a latent variable is the principal component analysis of standardised residuals.
This procedure is not ‘usual factor analysis’ but ‘shows contrasts between opposing factors, not loadings on one factor’
(Linacre, 2008, p. 250). This procedure points to possible items which may distort the unidimensional aspect of an instrument. The decision criteria for the
results emanating from this procedure were as follows:
Variance explained by measures > 60% is good.
Unexplained variance explained by 1st contrast (size) < 3.0 is good.
Unexplained variance explained by 1st contrast < 5% is good. (Linacre, 2008, p. 335)
Data obtained from implementation of the instrument rendered the variance explained by measures forthcoming from the empirical data as 27.2%. The expected
variance (for the data to fit the Rasch model) to be explained by measures was 28.0%. This difference was not deemed significant. The unexplained variance
emanating from the data was 72.8% and the Rasch model’s expectation is 72.0%; this can also be deemed as not significant. As is clear from the decision
criteria, the cut-off point of 60% was not met.
However, these percentages of the variances were to be expected, since the respondents were fairly homogeneous with regard to their teaching context and the
issue under discussion. The reported standardised residual variance for the first contrast of 3.1 is above the recommended cut-off point. Analysis of graphs
of the spread of items indicated that two items, one dealing with ‘Youth Dances’ and the other with ‘Youth Fashion’, stood out as operating
as a group independent of the rest of the items. These two items can be considered as conceptually linked around the notion of the behaviour of young people. The
respondents were mature adults, and it can reasonably be assumed that they viewed the two activities as related. Further analysis was done to ascertain the absence
of which of these two items produced a better unidimensional instrument. This analysis rendered that removal of the item dealing with ‘Youth Dances’,
with standardised residual variance for the first contrast of 2.8, enhanced the unidimensionality of the instrument. Further analysis proceeded using the instrument
now reduced to 16 items through removal of that dealing with ‘Youth Dances’.
A variety of other indicators can be calculated by the Rasch procedures, and these were interpreted to give an indication of the functioning of an attitudinal
instrument such as that under consideration here. The results emanating from these procedures are discussed in the next section.
Differential item functioning
Another important criterion for a measuring scale is that the items should not function differentially for different categories of participants comprising the
sample. Given that for the instrument under scrutiny here the participants were teachers of different genders, the items should not function differentially for
females and males. Analysis of differential item functioning along gender lines was conducted for the cohort of teachers. This analysis rendered that two items
(‘Pension and Retirement’ and ‘Health’) might be easier for female than for male teachers to endorse, and that a further two items
(‘Agriculture’ and ‘Emergency Services’) might be easier for male than for female teachers to endorse.
Although differential item functioning (DIF) is noticeable for these items, ‘For statistically significance DIF on an item, Prob. < .05’ (Linacre,
2008, p. 266). None of the reported probabilities for these items were less than 0.05 and hence DIF between female and male teachers was not statistically
significant for all the items of the scale. DIF was not performed for the other demographic dimensions since the sample was fairly homogeneous in respect of
their teaching environments.
Rank ordering of the items
As pointed out earlier, in a useful scale the items operationalising the abstract construct under discussion should form a hierarchy, so that it is possible
to conclude which of the items respondents would find easy and which they would find difficult to endorse. With Rasch modelling three values can be determined
to ascertain the hierarchical property of a scale: the measure of an item, and the infit mean square and the outfit mean square values respectively.
The measure of an item is the location on the scale. For a rating scale it indicates the level of difficulty for
endorsing the item. The difficulty of endorsement ‘of an item is defined to be the point on the latent variable at which it’s high and low categories
are equally probable’ (Linacre, 2008, p. 221).
Reeve and Fayers (2005) give the criterion for the spread of items to be deemed acceptable. These authors point out that
the measures should be in the range -2 to +2 logits. With the range for the instrument in this study being -0.94 to 1.46, as given in Table 2, this criterion was
fulfilled.
In Rasch analysis mean infit and outfit squares (see Table 2) are calculated to indicate ‘items which do not contribute to the definition of a coherent and
useful variable’ (Wright & Masters, 1982, p. vi). For items to have a good fit to the Rasch model, the decision criteria are:
values greater than 2.0 degrades measurement; values greater than 1.5 neither constructs nor degrades measurement; values from 0.5 to 1.5 are productive of
measurement and those less than 0.5 misleads us into thinking we are measuring better than we really are. (Linacre, 2008, pp. 221−222)
It is observable from Table 2 that the fit statistics for all the items were within the ‘productive of measurement’ range. In fact, both the infit
and outfit mean square values for all the items fell within this acceptable range. It is thus concluded that the reconstructed scale to measure the construct
‘teachers’ preference for real-life situations to be used in Mathematical Literacy’ forms a continuum.
The Rasch model can be used simultaneously to estimate a person’s ability (ability to endorse an item) and an item’s difficulty (or endorsability of
the item). The Winsteps software (Linacre, 2008) analysis presents these two estimates in a ‘person-item map’ which provides an indication of the
informativeness of the measures. Figure 1 gives the person map of items for teachers’ preferences for real-life situations to be used in Mathematical
Literacy. The 49 teachers appear on the left-hand side, with teachers with a high level of endorsement of the scale at the top and those with a low level of
endorsement at the bottom.
The items, with those ‘hard to endorse’ at the top and ‘easy to endorse’ at the bottom, appear on the right-hand side. Noticeable from
this figure is that the mean for the persons (M = 0.66, SD = 0.72) is higher than the mean for the items (M = 0.00, SD = 0.59), which suggests that the respondents
hierarchically endorsed the same items.
A further observation is that items in four sets of items (T11 and T5; T14 and T9; T17 and T3; T12, T13, T4 and T6) share the same location. Essentially this may
imply redundancy of items, and that the reliability of the instrument will not be influenced if only one of the shared items is used. However, for an instrument
dealing with affective issues, care should be taken with replacement, and conceptual considerations in addition to computational ones should drive decisions about
replacement of items. For example, T5 (Youth Fashion) and T11 (Lottery and Gambling) share the same location and are somewhat remotely conceptually linked, but are
different in terms of the mathematics related to them. They are thus not candidates for replacement. On the other hand, T9 (Pension and Retirement) and T14
(Inflation) can be considered as conceptually linked, because of the relationship they share in construction of pension and retirement scheme mathematical models.
At school level, however, they point to different mathematical topics and thus removing any one would not be sensible.
In Figure 1 gaps are apparent at five places (between T18 and T11; between T16 and T1; between T14 and T17; between T17 and T12 and between T2 and T7.)1
These gaps indicate that the items in these regions are not evenly spread. This might be a result of the homogeneity of the respondents, the small sample and strong
preferences, both negative and positive expression. For example, for T10 (‘Health’), the item found to be the easiest to endorse, 96% of the respondents
selected the categories ‘agree’ and ‘strongly agree’. T18 (‘Youth Fashion’) was the hardest to agree with, with only 8% selecting
‘strongly agree’.
The Rasch model reports a ‘person reliability’ measure which ‘is equivalent to the traditional “test” reliability’ (Linacre,
2008, p. 393). The person reliability for the teacher context preferences for real-life situations to be used in Mathematical Literacy was 0.65. ‘Low values
indicate a narrow range of person measures’ and person reliability of 0.5 ‘divides a sample into 1 or 2 groups’ (Linacre, 2008, p. 393). The
homogeneity of the sample accounts for the person reliability being low and points in the direction of a need for a more diverse sample for further development
of the instrument.
‘”Item reliability” has no traditional equivalent and low values indicate a narrow range of item measures, or a small sample’ (Linacre,
2008, p. 393). The item reliability obtained was 0.84 and gives a high level of support that the hierarchical ordering of the items in Table 2 will be reproduced
with a different sample of teachers working in a similar context as the respondents in this study.
The results obtained on the functioning of the instrument and the adjustments effected indicate that this was reasonable. The revised instrument resulted from
removal of misfitting persons and an item contributing to violation of the unidimensional character of the initial instrument. This has helped identify a unidimensional
trait representing Mathematics and Science teachers’ preferred contextual situations to be used in Mathematical Literacy.
|
Discussion and conclusion
|
|
The overall objective of the ROSME project is to ascertain and trace over time the real-life situations which learners, teachers and parents would prefer
to be used in Mathematical Literacy.
The teacher instrument is specifically aimed at ascertaining the contexts that teachers prefer. Expression by teachers of preferred contextual situations is
a subjective issue. However, for a variety of reasons – of which economic factors and expediency are the most important – it is desirable to have
some robust, easily implementable measurement instrument. This is because such an instrument will enable the assessment of real-life contexts that teachers
prefer to be used in Mathematical Literacy. Also, the instrument would allow for the tracking of teachers’ interests in contexts over time, in the same
way that the TIMSS and Programme for International Student Assessment instruments track the performance of learners in school Mathematics. Tracking is important
for informing decision-makers and learning resources developers of relevant real-life situations to include in such materials.
As Boone and Scantlebury (2006, p. 253) assert, ‘statistical confidence in [such] measures’ validity and reliability is essential.’
The results of the infit and outfit mean squares and standardised residual variance are indicative of the ROSME instrument’s ability to ascertain the
contextual situations that Mathematics and Science teachers prefer, bolstering this ‘statistical confidence’.
The fit statistics show that the instrument used to determine the contexts that teachers prefer for Mathematical Literacy reasonably identifies this variable.
Given that attitudinal instrument development is an iterative process, this finding points in the direction of further development with a more heterogeneous group
of teachers in terms of the socio-economic context within which they teach, to ascertain the universality of the instrument. In pursuing this path we will heed
the advice of Wright and Masters (1982, p. 102), that: ‘When items do not fit, that signifies … not the occasion for a looser model, but the need for
better items’.
Low endorsement of items points to areas in need of continuous professional development. So, for example, low endorsement was accorded to the item ‘Mathematics
involved in a lottery and gambling’. A plausible reason for this low endorsement is the attachment of negative consequences of this activity. A teacher
motivated the low endorsement status as follows: ‘If you want to instil positive value these [lottery and gambling] might be the
opposite effect’. In this instance teachers might not, as yet, have a sense of the mathematics involved in lottery and gambling and how this can be used
productively to inculcate the positive values they desire.
Niss (2007, p. 1306), in his assessment of the state of research related to problematiques in Mathematics Education, concludes that there is a ‘need
for investing a considerable amount of effort’ into researching issues related to the affective domain in Mathematics Education. In research on issues
related to affective issues pertaining to school mathematics, instruments are normally used without reporting the viability of these in measuring
the trait under consideration. Our analysis of one such instrument shows that much more care needs to be exercised in the construction of these. They should,
at a minimum, reasonably identify the latent traits they purport to measure in order to provide useful information on attitudinal issues related to school mathematics.
This research is supported by the National Research Foundation under Grant number FA2006042600032. Any opinions, findings and conclusions or recommendations
expressed in this material are those of the authors and do not necessarily reflect the views of the National Research Foundation.
Competing interests
We declare that we have no financial or personal relationships which may have inappropriately influenced us in writing this article.
Authors’ contributions
C.J. was the project leader and was responsible for experimental and project design. C.J. performed the analysis. L.H. and M.M. made conceptual
contributions. C.J., L.H. and M.M. wrote the manuscript.
Andrich, D. (1988). Rasch models for measurement. Thousand Oaks, CA: SAGE Publications.
Bond, T.G., & Fox, C.M. (2001). Applying the Rasch model: Fundamental measurement in the human sciences. Mahwah, NJ: Lawrence Erlbaum.
Boone, W., & Scantlebury, K. (2006). The role of Rasch analysis when conducting science education research utilizing multiple-choice tests.
Science Education, 90(2), 253−269. http://dx.doi.org/10.1002/sce.20106
Callingham, R., & Bond, T. (2006). Research in mathematics education and Rasch measurement. Mathematics Education Research Journal, 18(2),
1−10. http://dx.doi.org/10.1007/BF03217432
De Roos, Y., & Allen-Meares, P. (1998). Application of Rasch analysis; exploring differences in depression between African-American and White children.
Journal of Social Service Research, 23, 93−107.
Deselle, S.P. (2005). Construction, implementation, and analysis of summated rating attitude scales. American Journal of Pharmaceutical Education,
69(5), 1–11. http://dx.doi.org/10.5688/aj690597
Fowler, F.J. (1995). Improving survey questions: Design and evaluation. Thousand Oaks, CA: SAGE Publications.
Julie, C. (2002). Making relevance relevant in mathematics teacher education. In I. Vakalis, D. Hughes-Hallett, C. Kourouniotis, D. Quinney, & C. Tzanakis
(Eds.), Proceedings of the 2nd International Conference on the Teaching of Mathematics (at the undergraduate level), 01−06 July (pp. 1−8).
Hersonissos, Crete, Greece: University of Crete, [CD]. Wiley Publishers.
Julie, C., & Mbekwa, M. (2005). What would Grade 8 to 10 learners prefer as context for mathematical literacy? The case of Masilakele Secondary School.
Perspectives in Education, 23(3), 31−43. Available from
http://journals.sabinet.co.za/WebZ/images/ejour/persed/persed_v23_n3_a6.pdf?sessionid=01-38432-1480009827&format=F
Lessing, A., & De Witt, M. (2007). The value of continuous professional development: Teachers’ perceptions. South African Journal of Education, 27(1),
53−67. Available from http://journals.sabinet.co.za/WebZ/images/ejour/educat/educat_v27_n1_a4.pdf?sessionid=01-38432-106046365&format=F
Linacre, J.M. (2008). Winsteps® Rasch measurement computer program user’s guide. Beaverton, OR: Winsteps.com. Available from
http://www.winsteps.com/a/winsteps-manual.pdf
Mpofu, E., Caldwell, L., Smith, E., Flisher, A., Mathews, C., Wegner, L., et al. (2006). Rasch modeling of the structure of health risk behavior in South
African adolescents. Journal of Applied Measurement, 7(3), 323−334.
Niss, M. (2007). Reflections on the state and trends in research on Mathematics teaching and learning: from here to utopia. In F.K. Lester (Ed.),
Second handbook of research on mathematics teaching and learning (pp. 1293−1312). Charlotte, NC: National Council of Teachers of Mathematics.
Pring, R. (2005). Philosophy of educational research. London: Continuum.
Reeve, B., & Fayers, P. (2005). Applying item response theory modeling for evaluating questionnaire item and scale properties. In P. Fayers & R. Hays (Eds.),
Assessing quality of life in clinical trials: Methods and practice (pp. 55−76). New York, NY: Oxford University Press.
Swanepoel, C., & Booyse, J. (2006). The involvement of teachers in school change: A comparison between the views of school principals in South Africa and
nine other countries. South African Journal of Education, 26(2), 189−198.
Vermeulen, N. (2007). Mathematical literacy: Terminator or perpetuator of mathematical anxiety? In M. Setati, N. Chitera, & A. Essien (Eds.), Proceedings
of the 13th Annual National Congress of the Association for Mathematics Education of South Africa, Vol. 1 (pp. 368−380). Johannesburg: AMESA.
Wright, B.D., & Masters, G.N. (1982). Rating scale analysis. Chicago, IL: MESA Press.
Zevenbergen, R., Sullivan, P., & Mousley, J. (2002). Contexts in mathematics education: Help? Hindrance? For whom? In P. Valero & O. Skovsmose (Eds.),
Proceedings of the 3rd International Mathematics Education and Society Conference (pp. 1−9). Copenhagen: Centre for Research in Learning
Mathematics. Available from http://www.mes3.learning.aau.dk/Papers/Zevenbergen_et_al.pdf
|
|
