|
This study looked at how a group of South African secondary school mathematics teachers regarded the concept of gradient (slope). Results are reported from nine free-response items on a paper-and-pencil
test administered to practising teachers who were pursuing qualifications to teach Grades 10–12 mathematics through an Advanced Certificate in Education (ACE) programme. The findings suggest that
teachers’ understanding of gradient varies greatly. A number of teachers inthe study demonstrated very little to no understanding of this important concept, whilst others demonstrated a strong
understanding of gradient and were able to conceptualise it in many different ways. Implications for teacher professional development are considered.
Adoption of a new curriculum in mathematics in South Africa (Department of Education, 2003) brought with it the need for more appropriately qualified teachers to teach Grades 10–12 mathematics. Many of the mathematics teachers in the areas that serve historically disadvantaged communities are themselves members of thesame disadvantaged groups. It has been difficult for these teachers to acquire the qualifications needed to teach Grades 10–12 mathematics. Whilst policy changes have had less impact on private schools, the shortage of qualified mathematics teachers in public schools, particularly those in rural areas, has been labelled ‘critical’ by Adler and Davis (2006), who provide a succinct overview of the history of teacher education in South Africa. More importantly, though, they emphasise theidea that the majority of practising teachers from historically disadvantaged groups face the challenge of having training in mathematics that constituted a three-year certification, and entered their careers with limited mathematics content knowledge. This has now created an urgent need for these teachers to become re-certificated in mathematics content knowledge. A large university in KwaZulu-Natal in South Africa recently implemented an Advanced Certificate of Education (ACE) programme to address the shortage of qualified mathematics teachers in its region. This ACE programme provides an alternate way for practising teachers, especially those serving historicallydisadvantaged communities, to obtain minimal qualifications to teach mathematics in Grades 10–12. The intervention was specifically created in order to help prepare under- and unqualified teachers currently teaching mathematics to meet the minimal qualifications for teaching mathematics. The ACE programme offers flexible delivery at multiple open learning centres and is structured to reach some of the most remote rural and disadvantaged communities. However, little is known about the mathematical knowledge of teachers enrolled in the ACE programme. Is their mathematical knowledge robust enough to allow them to present the key, fundamental mathematical ideas as a ‘unified body of knowledge’ (Ma, 1999, p. 122)? How deeply do these teachers understand the keyconcepts in Grades 10–12 mathematics? The more that is known about how teachers in ACE programmes conceptualise key concepts, the better modules in the ACE programme can be adapted to provideeducational experiences that will be of maximum benefit to those teachers. It is crucial to consider teachers’ current knowledge in order to connect to and build on it, so that teachers are able to develop a strong understanding of the content represented by the concept itself, utilise various representations of the concept and recognise their particular affordances, and make curricular connections to the content both within and outside mathematics. For these reasons, this study focuses onteachers’ understanding of gradient, a key concept that cuts across many areas in mathematics, including those most commonly addressed in Grades 10–12. More specifically, the study described in this article was driven by the following research question: ‘How do practising teachers, who teach historically disadvantaged students and who are pursuing
qualifications to teach mathematics in Grades 10–12, understand the concept of gradient?’
Research provides evidence of students’ weak covariational reasoning (i.e. the ability to reason simultaneously about how one quantity changes as another relatedquantity also changes), including difficulties with the concepts of slope (or gradient, as the concept is commonly referred to in South Africa) and rate of change (Barr, 1981; Carlson, Jacobs, Coe, Larson & Hsu, 2002; Orton, 1984; Stump, 2001a, 2001b; Teuscher & Reys, 2010). There has been particular evidence of students’ inability to make connections between various representations of these concepts. Stump (2001b) found that students held varying views of gradient as an angle, aformula, rise over run or steepness, and that students did not make connections between rate of change and gradient. Some studies (Moore-Russo, Conner & Rugg, 2011; Stump, 1999) have helped identify and have analysed the many different ways in which the concept of gradient can be conceptualised (Stanton & Moore-Russo, in press). Moore-Russo and
colleagues (Moore-Russo et al., 2011; Stanton & Moore-Russo, in press) have suggested 11 conceptualisations of gradient, basedon their own research and the earlier work of Stump (1999, 2001a, 2001b), which are summarised in Table 1. In this study the same 11 conceptualisations were used to determine South African teachers’ understanding of gradient. Although very little research has investigated teachers’ understanding of gradient, Coe (2007) reported that secondary mathematics teachers showed difficulty in working with average rates of change, and could not explain the use of division in the formula for gradient in the algebraic ratio conceptualisation of gradient. In her study, Stump (1999) found the most common conceptualisation of gradient amongst secondary teachers to be a geometric ratio (the ratio of the rise of a linearfunction to its run). In the same study, Stump also reported that teachers expressed concern about their students’ understanding of gradient; however, the teachers focused on students’ difficulties in the procedures for determining gradient rather than their conceptual notions of gradient. This prompted the suggestion that ‘… both pre-service and in-service mathematics teachers need opportunities to examine the concept of slope … [and] to construct connections amongst
its variousrepresentations’ (Stump, 1999, p. 142).
|
TABLE 1: Eleven conceptualisations of gradient.
|
The mathematical knowledge for teaching framework introduced by Ball, Thames and Phelps (2008) served as the underpinning theory for this study. Shulman (1986) suggested three categories of teacher knowledge: content knowledge, pedagogical content knowledge, and curricular knowledge. Elaborating on Shulman’s seminal work, Ball et al. (2008) divide mathematical knowledge for teaching into subject matter knowledge (SMK) and pedagogical content knowledge (PCK). Ball et al. (2008, p. 402) have labelled SMK as the ‘relatively uncharted arena of mathematical knowledge necessary for teaching that is not intertwined with the knowledge of pedagogy, students, curriculum, or other non-content domains’. Their theory highlights the fundamental components of SMK by further dividing itinto common content knowledge (CCK) and specialised content knowledge (SCK), as well as provisionally suggesting a third domain, horizon content knowledge (sometimes simply referred to as horizon knowledge). Teachers’ CCK provides the foundations upon which they develop their SCK and horizon content knowledge. CCK is outlined as the knowledge and skills held by educated adults that are essential and used in a wide variety of settings. SCK represents the deep, flexible, nuanced understanding of mathematics that is uniquely related to teaching; it includes, amongst other things, knowing how concepts are represented, related, developed, and validated. It allows teachers to ‘mediatestudents’ ideas, make choices about representations of content, modify curriculum materials, and the like’ (Ball & Bass, 2000, p. 97). Horizon content knowledge relates to understanding how mathematical knowledge is related and connected to more advanced mathematical concepts. If ACE programmes are to help teachers develop their mathematical knowledge for teaching, then these programmes should be aware for teachers’ CCK. The research reported in this study looked at the CCK of a single concept – gradient – in a group of historically disadvantaged South African mathematics teachers enrolled in an ACE programme to pursue qualifications to teach mathematics in Grades 10–12. The study focused specifically on the teachers’ conceptualisations ofgradient using the 11 conceptualisations suggested by Moore-Russo et al. (2011) to frame the analysis of the study.
Methodology
Participants and data collection
Data were collected from 251 practising teachers from eight different project sites in KwaZulu-Natal during the summer of 2010. The data come from teachers’responses to a paper-and-pencil pre-test that was administered prior to the concept of gradient being addressed in the ACE programme. All of the participant teachers were from historically disadvantaged communities, and all were teaching in schools whose student populations were historicallydisadvantaged. Some were teaching Grades 10–12 mathematics without appropriate qualifications; others were teaching mathematics at Grade 9 and below. A third, smaller group was teaching other subject areas at the time; they were using the programme as a way to retrain to become mathematics teachers. Enrolment in this ACE programme had no cost implications for the teachers since funding was provided by the provincial Department of Education. Nine of the 27 items on the pre-test were free-response and addressed the concept of gradient; only these items were used in the analysis for this study. The teachers were instructed to show all working details and to provide an explanation for how they arrived at the answer for each of the nine items. The nine items (provided inthe Appendix), were purposely composed so as to elicit responses from the teachers that made use of a variety of the 11 conceptualisations of gradient (Table 1).
Data analysis
The unit of analysis was a teacher’s response to a single pre-test item. Since 251 teachers answered nine items, there were exactly 2259 responses (304 of which were blank) that were analysed. Data analysis began with creating task-specific rubrics for each item. Each rubric was customised to address the item, but was generally based on the scoring rubric provided in Table 2. The rubric for each item was based on a scale of 0 to 2. For each item the score assigned considered not only the finalanswer but also the teacher’s entire response, including all writing, equations, tables and drawings used in the explanation related to that item.
Reliability and external validity
The test items were carefully selected after much deliberation between the researchers, and all ambiguity and unnecessary distracters were removed. The researchers ensured that the questions chosen were ones that these practising teachers would have encountered in their school learning and in their teaching. The language used was sufficiently basic so that most teachers would be able to understand the words used. The participants came from various parts of KwaZulu-Natal and hence we could postulate that these teachers represented a close approximation of how other teachers with similar qualifications and backgrounds would respond to the selected questions. Nonetheless, no broad generalisations are being made.
Internal validity
Both members of the research team scored all teacher responses to each item independently. Proportion agreement for each of the nine items was above 0.97. TheCohen kappa statistic for each item was well above 0.80, which is considered ‘almost perfect’ agreement (Landis & Koch, 1977, p. 165). The two independent scorers reached consensus by means of discussion for each response they had coded differently. After the items were scored, the research team reviewed the data to find any patterns in teachers’ responses.
Ethical considerations
On arrival at the lecture venue all teachers were informed by the lecturing staff that the test was intended for two purposes: firstly, it was to be used as a meansof establishing their prior knowledge so that we could measure their progress during the course of the module, and secondly, their responses were to be used in research, but their anonymity was guaranteed. All participating teachers signed a document acknowledging the fact that they were aware that their responses would be used for research purposes.
|
TABLE 2: General scoring rubric for teacher responses.
|
Teachers’ total scores on the nine items ranged from the minimum possible score of 0 to the maximum possible score of 18. Figure 1 displays the distribution of thetotal scores assigned to teachers’ responses, and shows the wide distribution for the teachers’ total scores. The mean total score per teacher was 9.66 (SD 5.16). Table 3 displays the frequency of scores that were assigned to teachers’ responses on each of the nine items. The mean score for all items was 1.07. Those with the three highest mean scores were Item 6 (1.42), Item 1 (1.26) and Item 4 (1.22), whilst those with the three lowest mean scores were Item 3 (0.92), Item 8 (0.84) and Item2 (0.73). Before discussing teachers’ responses to the nine items, it is necessary to outline what these items entailed. The preamble to the first three questions required theteachers to understand a contextualised problem, which stated that to take out a text-only advertisement in the newspaper cost R10.00 plus an additional R1.00 for each word. Item 1 asked that the teachers should write an equation that represented the cost of the advertisement (C) in terms of the number of words (W). Item 2 asked the teachers to draw a graph of the situation, and Item 3 required them to write down the gradient of the graph. The rest of the items had different graphsdrawn and the teachers had to respond to particular questions based on them. Although Item 1, Item 2 and Item 3 were based on the same situation, the results for these items varied greatly: whilst 141 (or 56%) of the teachers responded with thecorrect formula for the situation in Item 1, only 63 (or 25%) of the teachers were able to draw the correct corresponding graph for Item 2. In fact, only six teachers scored higher on Item 2 than on Item 1. Moreover, 27 of the teachers who drew a graph for Item 2 provided graphs that were non-linear. Since teachers could have used the situation – the equation (from Item 1) or the graph (from Item 2) – to find the gradient in Item 3, it might seem reasonable to consider that more teachers would have been able to determine the correct gradient than responded correctly to either Item 1 or Item 2. However, only 85 (or 34%) of the teachers responded with the correct value for the gradient, and 64 teachers (26%) left this question blank (as opposed to 13 and 38 teachers who did not offer any responses for Item 1 and Item 2 respectively). Scores for Item 1 and Item 2 would have been even lower had the discrete nature of the situation been taken into account in assigning scores. Item 1 asked for an equation, but did not ask for the domain of the function, so responses that included the correct equation were given a score of 2, even though only one teacher included in his explanation that the domain should be limited to positive integers. Teachers who drew a continuous straight-line graph that represented the equationin Item 2 were also given a score of 2, since the scoring was meant to measure teachers’ understanding of slope, not their understanding of domain. Only seven teachers drew discrete points in a linear manner that represented the situation with its domain limited to positive integers. Figure 2 shows two examples of teacher responses for Item 1 and Item 2 that were scored as 1; these teachers demonstrated just a partial understanding of the concepts being tested. Teachers’ responses provided evidence as to the conceptualisations of gradient that they held. When a teacher’s explanation included reasoning that related to a conceptualisation of gradient, it was noted. Table 4 provides the frequency distribution for each of the 11 conceptualisations of gradient evidenced in the teachers’ responses; however, it is possible that teachers held more conceptualisations than were evidenced in their responses. The most common conceptualisations ofgradient found were parametric coefficient (for 153 teachers) and behaviour indicator (for 135 teachers), whilst the least noted were real-world situation (for 17 teachers) and physical property (for 9 teachers). The low numbers for real-world situation could be misleading since 56 of the 251 teachers responded correctly to Item 1, Item 2 and Item 3, all of which related to a real-world situation; however, this may not be the case considering that only eight teachers considered the discretenature of the domain for the situation. Table 5 displays the number of teachers who held varying amounts of conceptualisations of gradient. The mean number of conceptualisations of gradient evidencedas being held by teachers was 3.15 (SD = 2.02). As previously stated, it is possible that teachers held more conceptualisations than were evidenced in their responses. Teachers’ responses also provided evidence that they held a number of misconceptions. The most common misconception (found in 29 of the teachers’ responses,and all occurring for Item 5 and Item 8) was that a line that goes through the origin must have a gradient of zero. The second most common misconception (which occurred in 26, or over 10% of the responses and was found exclusively on Item 8), involved teachers ignoring the units marked on the graph and assigning a gradient of 2 to an increasing linear function whose gradient was 1. A related misconception occurred in 22 responses to various problems, when teachers created markingswith specific values on axes when none were given, leading them to various incorrect assumptions. A misconception that occurred in 20 responses (all on Item 6) was that horizontal lines have no gradient (instead of a gradient of 0). In 19 responses, all on Item 2,nonconventional labelling of units was used on the axes such that the axes were made to cross at a point other than (0, 0). Fifteen teachers’ responses (on various items) confused the gradient with the y intercept in a linear equation. All other errors occurred in fewer than 15 responses.
|
TABLE 3: Frequency distribution of scores per item.
|
|
TABLE 4: Frequency distribution for teachersí conceptualisations of gradient.
|
|
TABLE 5: Frequency distribution for teachersí varying amounts of
conceptualisations of gradient.
|
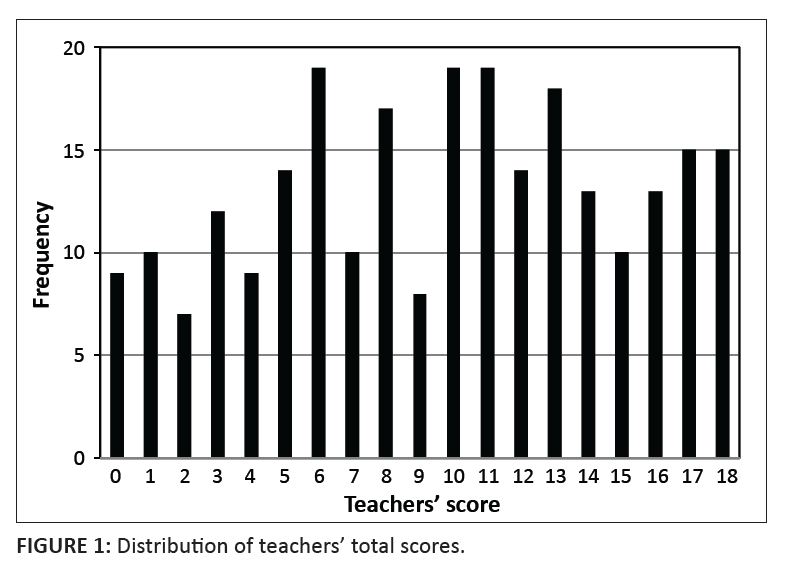 |
FIGURE 1: Distribution of teachers’ total scores.
|
|
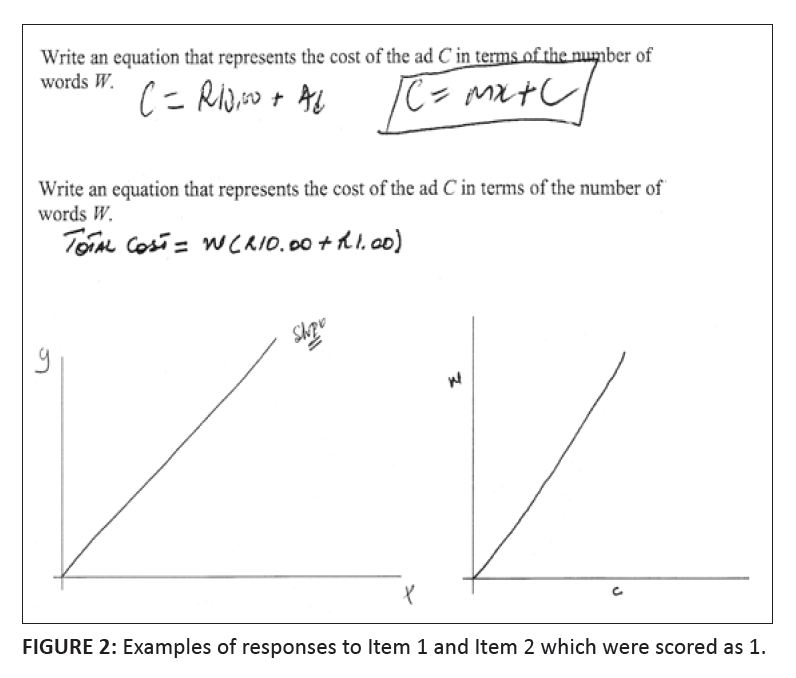 |
FIGURE 2: Examples of responses to Item 1 and Item 2 which were scored as 1.
|
|
The findings suggest that those teachers participating in the study varied greatly in their understanding of gradient. Evidence to support this comes from three findings: the wide range of total scores assigned to the teachers; the fact that on eight of the nine items, teachers’ responses were assigned scores of 0 or 2 morefrequently than scores of 1; and the wide range in the number of conceptualisations of gradient evidenced in teachers’ responses. In particular, the current study sheds light on the dire situation that faces some of the historically disadvantaged students who have teachers with little or nounderstanding of gradient. Of all 2259 of the teachers’ responses, 818 (36%) received scores of 0, and only 143 of the 251 teachers were able to obtain 9 or more out of 18 points (50%) as a total score on the nine items. Even though the items may not have elicited all possible conceptualisations of gradient from all teachers, it is surprising to find that 101 of the 251 teachers (40%) evidenced only two or fewer conceptualisations on all nine items. In contrast, some of the teachers displayed a strong understanding of gradient. Of the 251 teachers, 42 missed two or fewer points out of the 18 possible points for the teachers’ total score. Also, 34 of the teachers demonstrated that they held at least six different conceptualisations for gradient. The varied scores for Item 1, Item 2 and Item 3 might suggest that teachers do not make the connections between various representations of functions. Teachers who responded to Item 1 with the correct equation and with a correct graph of that equation in Item 2 often did not show evidence of relating either the equation or the graph to the situational context. An example here is the teacher who drew a graph with a positive gradient but declared that the gradient is negative (Figure 3). Thismay be indicative of the fact that in general teachers do not engage in the iterative process between the contextual situation and its mathematisation. Results suggest that transforming from a written situation to an equation was easier for the teachers than transforming to a graph or determining the gradient. Manyteachers were able to determine the equation but were not able to identify the gradient of a given situation. Even though the parametric coefficient was one of the most noted conceptualisations in teachers’ responses, this suggests that it is not a conceptualisation held by all teachers.
Limitations and future work
Whilst this study provides valuable data, its limitations should be noted. Firstly, item selection might have impacted the types of conceptualisations evidenced by the teachers in their responses. One can only ponder how the scores might have differed if Item 1, Item 2 and Item 3 had not been related to the same situation, or ifresponses to a linear graph with a negative slope had been included that did not have the origin as its y intercept (as did Item 5). The disregarding of the units on the axes, coupled with the inappropriate and inaccurate overuse of the behaviour indicator conceptualisation, might indicate twonotions that both merit further study. The first notion is that teachers’ struggles with graphing on the Cartesian plane, as noted in Item 2 and Item 8, impact their understanding of gradient. A large number of the misconceptions that were noted related to the axes, including their erroneously labelling and disregarding the units on the axes. The second notion is that the behaviour indicator conceptualisation is much stronger than, and possibly interferes with, other conceptualisationslike geometric ratio and trigonometric conception. This notion is supported by the large number of teachers who simply looked at the graph without using the grid that was provided on Item 8. It is also supported by the responses to Item 9, where teachers often looked at the graph without considering the angle and declared that the answer to the question was y = x. In general, this study provides a much-needed first look at teachers’ conceptualisations of gradient. It would be interesting to follow this study with another that includes items written to intentionally elicit conceptualisations by the teachers that were less noted in their responses in this study. Perhaps the best methods to usefor such future studies would be more qualitative approaches, possibly using interviews. The idea of a key mathematical concept having multiple conceptualisations can be applied beyond this study. It would be appropriate and useful for themathematics education research community to identify other key concepts and consider their various conceptualisations in future work.
Implications for professional development
Gradient is a concept in the secondary mathematics curriculum of most countries. Paradoxically, this important concept is ‘well known but not well understood’ (Moore-Russo et al., 2011, p. 3). This study adds to the research literature by providing additional insight into common misconceptions that seem to impact on teachers’ understanding of gradient. This has implications for the professional development of teachers that extend past the concept of gradient. Teachers shouldengage in activities that require them to transform between representations of the same mathematical idea, make connections between various representations of the same idea, and consider the basic principles of the Cartesian coordinate system (e.g. the orthogonal intersection of real number lines at the zero value of each, the independent nature of the scale of the two axes). One of the greatest challenges facing those involved in professional development is how to deal with teachers who enter programmes with little to no CCK. Whilst not the focus of this article, the methods employed in the instructional setting suggest that pre-test data can be collected to inform instructional decisions. Forexample, results of the pre-test helped identify those teachers who had strong (as well as weak) understandings of gradient. The pre-test results also helped the instructional team to realise some of the common misconceptions that teachers held. During the second tutor training session, tutors were specifically instructed to concentrate on aspects that we thought were problematic. An example of what we thought could be a misconception is illustrated in Figure 4: the teacher hadwritten the correct equation (C = w + 10), but drew the graph as C = w. It is perhaps the case that the teacher believed that because the gradient was equal to 1, the graph would pass through the origin. On a final note, another challenge is how to handle professional development when some teachers have weak CCK whilst others seem to have strong CCK. Teacher educators need to develop differentiated activities in which the teachers would engage that are appropriate and challenging for both groups. To do so, teacher educators should consider the conceptualisations that most teachers hold for a particular mathematical concept, help teachers recognise that concepts can beconceptualised in various ways, challenge all teachers to develop some of their weaker conceptualisations of a concept better, and help teachers see the connections amongst and benefits related to the various conceptualisations of a concept.
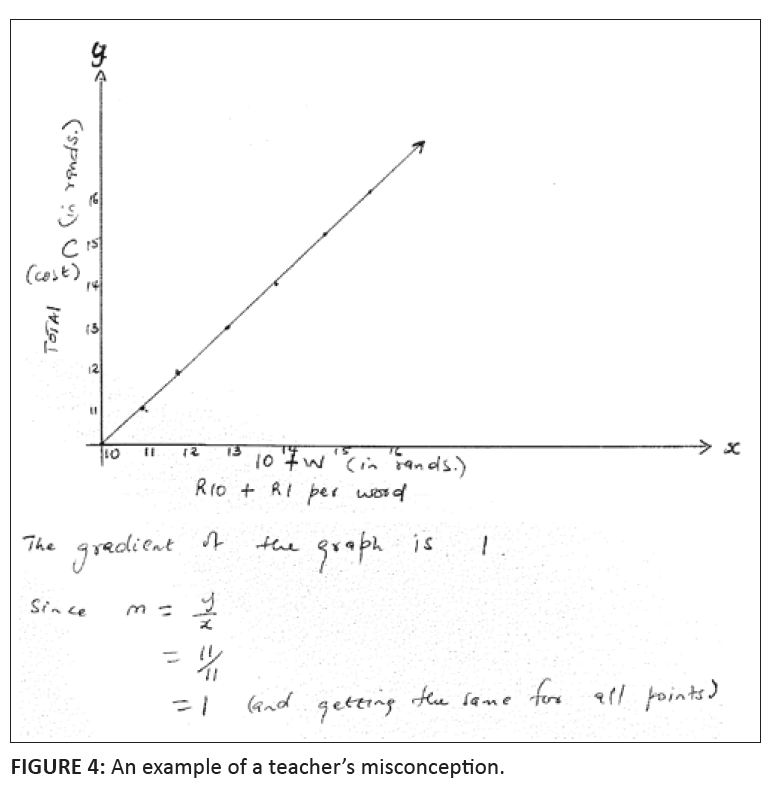 |
FIGURE 4: An example of a teacher’s misconception.
|
|
We acknowledge funding from a grant from the United States Agency for International Development, administered through the non-governmental organisation Higher Education for Development for research on the different modules in the ACE certification programme. No specific grant was obtained for this particulararticle.
Competing interests
We declare that we have no financial or personal relationship(s) which may have inappropriately influenced us in writing this article.
Authors’ contributions
D.M-R. had originally conceptualised the items for the test, and V.M. made further suggestions. Administering of the tests was managed by V.M., and the scoring of data was done separately then jointly by both D.M-R. and V.M. The manuscript was written with contributions from both authors, and editorial corrections were also completed by both authors.
Adler, J., & Davis, Z. (2006). Opening another black box: Researching mathematics for teaching in mathematics teacher education. Journal for Research in Mathematics Education,
3(4), 270−296.
Ball, D.L., & Bass, H. (2000). Interweaving content and pedagogy in teaching and learning to teach: Knowing and using mathematics. In J. Boaler (Ed.), Multiple perspectives on theteaching and
learning of mathematics (pp. 83−104). Westport, CT: Ablex.
Ball, D.L., Thames, M.H., & Phelps, G. (2008). Content knowledge for teaching: What makes it special? Journal of Teacher Education, 59, 389−407.
http://dx.doi.org/10.1177/0022487108324554
Barr, G. (1981). Student ideas on the concept of gradient. Mathematics in School, 10(1), 16−17.
Carlson, M., Jacobs, S., Coe, E., Larsen, S., & Hsu, E. (2002). Applying covariational reasoning while modelling dynamic events: A framework and a study. Journal for Research in
Mathematics Education, 33(5), 352−378. http://dx.doi.org/10.2307/4149958
Coe, E. (2007). Modeling teachers’ ways of thinking about rate of change. Unpublished doctoral dissertation. Arizona State University, Phoenix, United States. Available from
http://pat-thompson.net/PDFversions/Theses/2007Ted.pdf
Department of Education. (2003). National curriculum statement Grades 10−12 (General): Mathematics. Pretoria: Department of Education.
Landis, J.R., & Koch, G.G. (1977). The measurement of observer agreement for categorical data. Biometrics, 33(1), 159−174. http://dx.doi.org/10.2307/2529310, PMid:843571
Ma, L. (1999). Knowing and teaching elementary mathematics: Teachers’ understanding of fundamental mathematics in China and the United States. Mahwah, NJ: Lawrence Erlbaum Associates.
Moore-Russo, D., Conner, A., & Rugg, K.I. (2011). Can slope be negative in 3-space? Studying concept image of slope through collective definition construction. Educational Studies
in Mathematics, 76(1), 3−21. http://dx.doi.org/10.1007/s10649-010-9277-y
Orton, A. (1984). Understanding rate of change. Mathematics in School, 13(5), 23−26.
Shulman, L.S. (1986). Those who understand: Knowledge growth in teaching. Educational Researcher, 15(2), 4−14. http://dx.doi.org/10.3102/0013189X015002004
Stanton, M., & Moore-Russo, D. (in press). Conceptualizations of slope: A look at state standards. School Science and Mathematics.
Stump, S. (1999). Secondary mathematics teachers’ knowledge of slope. Mathematics Education Research Journal, 11(2), 124−144. http://dx.doi.org/10.1007/BF03217065
Stump, S. (2001a). Developing preservice teachers’ pedagogical content knowledge of slope. Journal
of Mathematical Behavior, 20(2), 207–227. http://dx.doi.org/10.1016/S07323123(01)00071-2
Stump, S. (2001b). High school precalculus students’ understanding of slopes as measure. School Science and Mathematics, 101(2), 81−89. http://dx.doi.org/10.1007/BF03217065
Teuscher, D., & Reys, R. (2010). Slope, rate of change, and steepness: Do students understand these concepts? Mathematics Teacher, 103(7), 519−524.
|
